Fig. 9
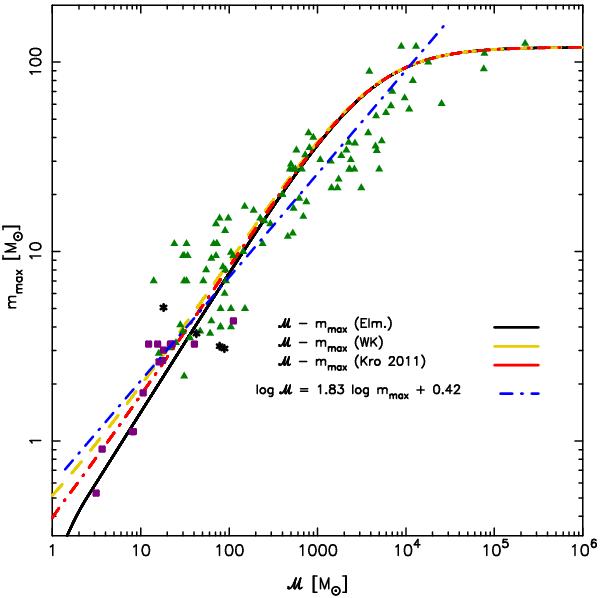
ℳ − mmax relationship resulting from the distribution function formulation of the IMF of Elmegreen (1997, 1999, 2000), the formulation of Weidner & Kroupa (2004, 2006), and the optimal sampling formulation of Kroupa et al. (2011). The figure includes data points from Weidner et al. (2010) and Kirk & Myers (2011) and the result of the linear fit of the data to log ℳ as a function of log mmax.
Current usage metrics show cumulative count of Article Views (full-text article views including HTML views, PDF and ePub downloads, according to the available data) and Abstracts Views on Vision4Press platform.
Data correspond to usage on the plateform after 2015. The current usage metrics is available 48-96 hours after online publication and is updated daily on week days.
Initial download of the metrics may take a while.