Free Access
Fig. 6
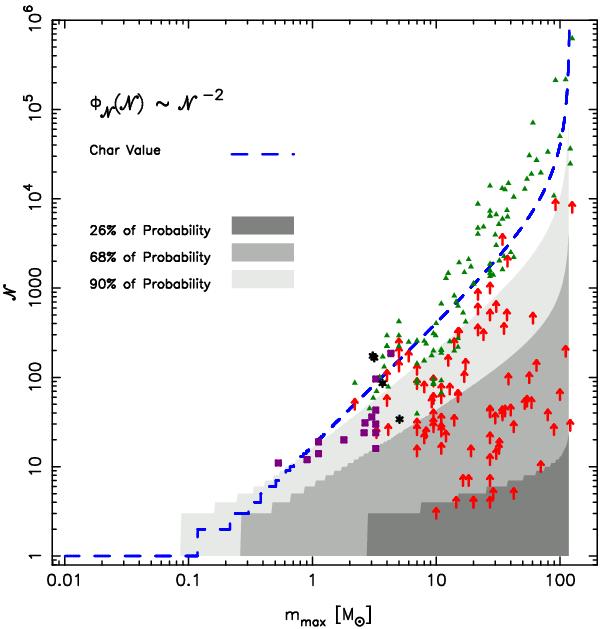
Confidence interval analysis of  as a function of mmax for a
  . Arrows: data points by Weidner et al. (2010) using
  without correction of incompleteness due to unobserved stars. Other symbols have the same meaning as in Fig. 3.
Current usage metrics show cumulative count of Article Views (full-text article views including HTML views, PDF and ePub downloads, according to the available data) and Abstracts Views on Vision4Press platform.
Data correspond to usage on the plateform after 2015. The current usage metrics is available 48-96 hours after online publication and is updated daily on week days.
Initial download of the metrics may take a while.