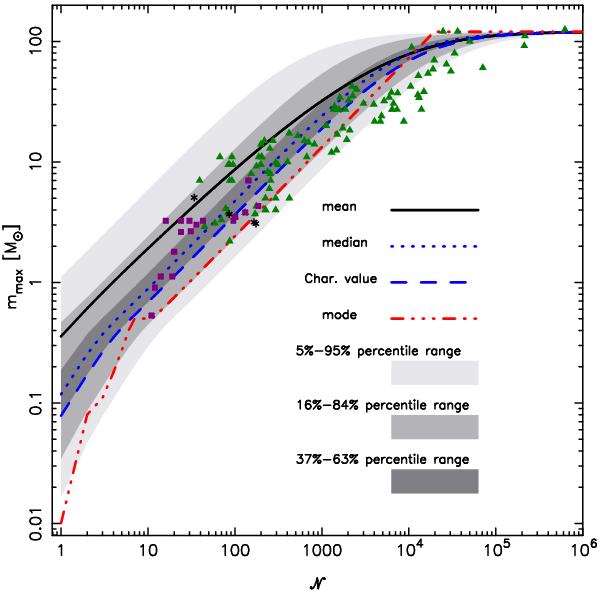
Fig. 3
Percentile analysis around the median of  as a function of
  (shaded areas). The figure includes as a reference the position of the characteristic value, median, mean, and mode of the distribution. Small triangles: compilation by Weidner et al. (2010) of observational values of mmax and inferred values of
  obtained from observations; squares: observed values of and mmax from Kirk & Myers (2011); stars: observed values of and mmax in the field for the four observed regions from Kirk & Myers (2011).
Current usage metrics show cumulative count of Article Views (full-text article views including HTML views, PDF and ePub downloads, according to the available data) and Abstracts Views on Vision4Press platform.
Data correspond to usage on the plateform after 2015. The current usage metrics is available 48-96 hours after online publication and is updated daily on week days.
Initial download of the metrics may take a while.