Fig. 1
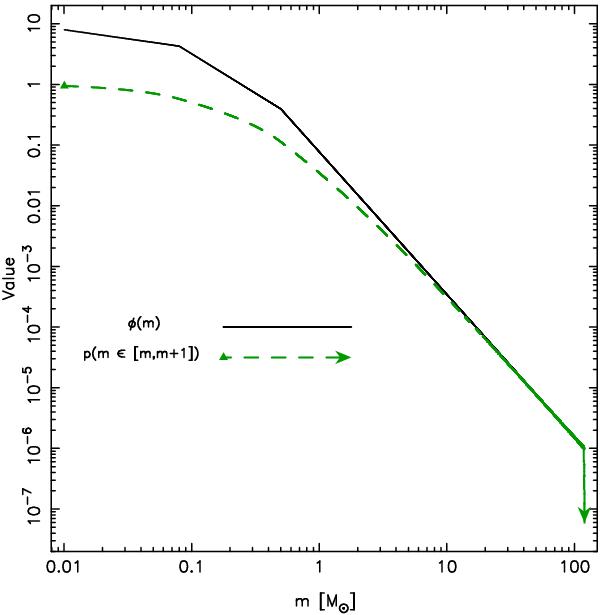
IMF used in the present work (solid line), as in the parametrization by Kroupa (2001, 2002) and Weidner & Kroupa (2006). Being a PDF, it can have values larger than one; the probabilities are given by the integral over the PDF. We also plot the probability that a star has a mass in the m,m + 1 M⊙ range, which is lower than one (dashed line). This probability declines rapidly when m is larger than mup − 1 M⊙.
Current usage metrics show cumulative count of Article Views (full-text article views including HTML views, PDF and ePub downloads, according to the available data) and Abstracts Views on Vision4Press platform.
Data correspond to usage on the plateform after 2015. The current usage metrics is available 48-96 hours after online publication and is updated daily on week days.
Initial download of the metrics may take a while.