Free Access
Fig. 7
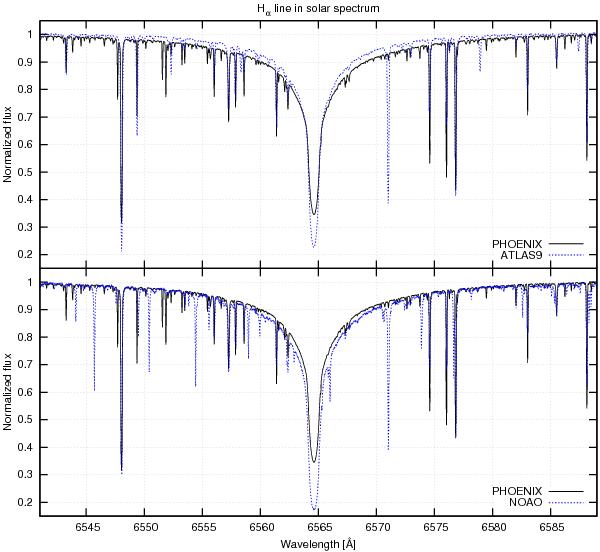
Comparison between PHOENIX (full line) and ATLAS9 (dotted line) model spectra for the Sun in full resolution (R = 500 000) in the upper plot. Below the PHOENIX spectrum (full line) is compared to a solar spectrum observed by Wallace et al. (2011).
Current usage metrics show cumulative count of Article Views (full-text article views including HTML views, PDF and ePub downloads, according to the available data) and Abstracts Views on Vision4Press platform.
Data correspond to usage on the plateform after 2015. The current usage metrics is available 48-96 hours after online publication and is updated daily on week days.
Initial download of the metrics may take a while.