Fig. 4
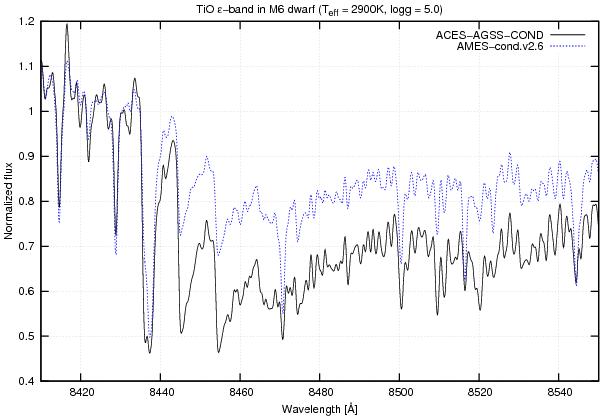
New PHOENIX ACES model spectra (full line) compared to PHOENIX AMES v2.6 spectra (dotted line); both models are calculated for a typical M 6 main sequence star (Teff = 2900 K, log g = 5.0) and smoothed to an effective resolution of R = 10 000. The ACES model spectra produce significantly deeper TiO bands than earlier PHOENIX models.
Current usage metrics show cumulative count of Article Views (full-text article views including HTML views, PDF and ePub downloads, according to the available data) and Abstracts Views on Vision4Press platform.
Data correspond to usage on the plateform after 2015. The current usage metrics is available 48-96 hours after online publication and is updated daily on week days.
Initial download of the metrics may take a while.