Free Access
Fig. 2
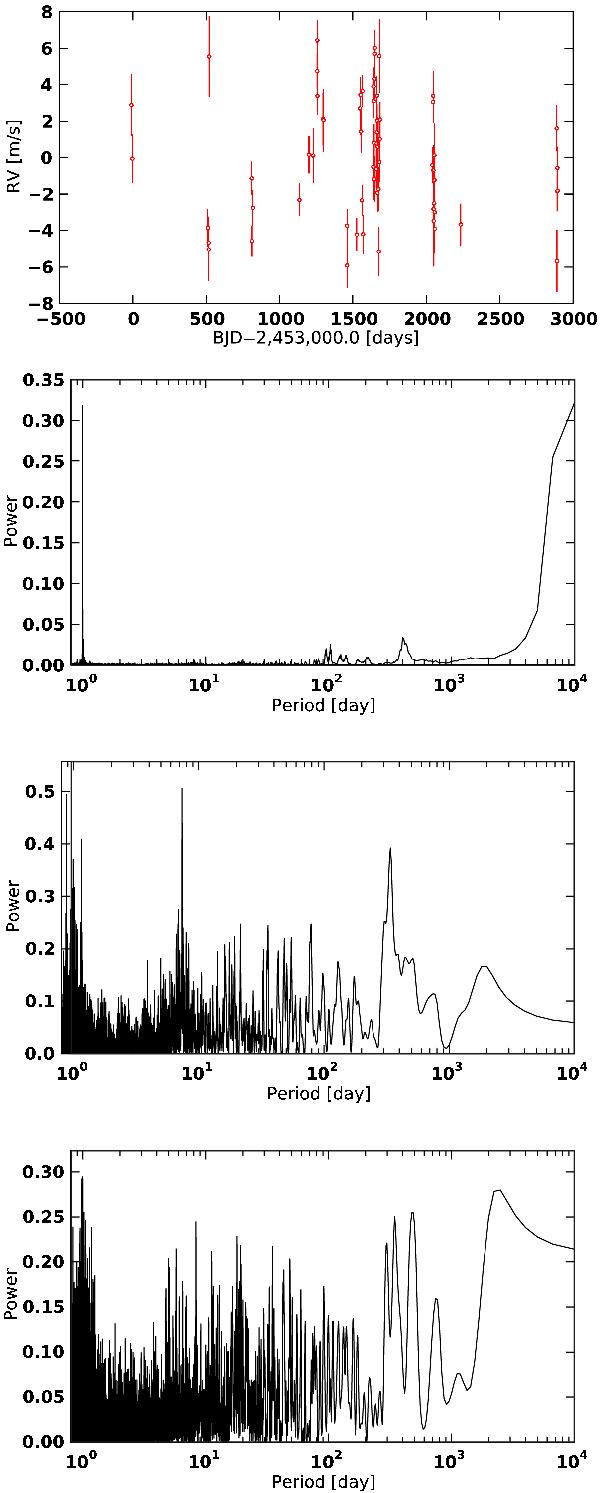
From top to bottom: (1) HARPS RV data for Gl 433; (2) window function of the measurement; (3) periodogram of the HARPS measurements; and (4) periodogram of the residuals after substraction of the 7.3 day period.
Current usage metrics show cumulative count of Article Views (full-text article views including HTML views, PDF and ePub downloads, according to the available data) and Abstracts Views on Vision4Press platform.
Data correspond to usage on the plateform after 2015. The current usage metrics is available 48-96 hours after online publication and is updated daily on week days.
Initial download of the metrics may take a while.