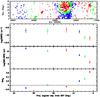
Fig. 9

Top panel: the sky distribution of LTGs within seven annuli of increasing radius from M 87. Galaxies in each ring are given with a different color. b) SSFR; c) SFR per unit HI mass; d) HI-deficiency as function of the projected angular separation from M 87. Bottom panel: same as above in bins of local galaxy density. This analysis is limited to galaxies with projected distance <45° from M 87, i.e., 20 objects in the interval 15:00:00 < RA < 16:00:00) were excluded because they do not constitute a statistically meaningful subset.
Current usage metrics show cumulative count of Article Views (full-text article views including HTML views, PDF and ePub downloads, according to the available data) and Abstracts Views on Vision4Press platform.
Data correspond to usage on the plateform after 2015. The current usage metrics is available 48-96 hours after online publication and is updated daily on week days.
Initial download of the metrics may take a while.