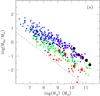
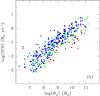
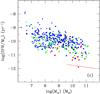
Fig. 8
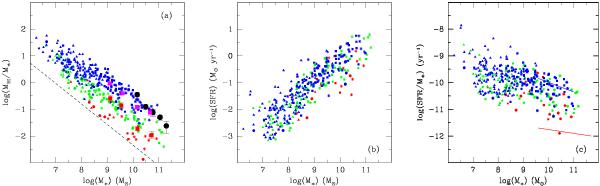
Scaling relations of HI mass, stellar mass and SFR for galaxies in three classes of increasing DefHI blue: DefHI ≤ 0.3 (normal); green: 0.3 < DefHI < 0.9 (perturbed), red: DefHI ≥ 0.9 (highly perturbed). Symbols are assigned according to the morphology. E-S0-S0a: circles; giant spirals (Sa-Sm): squares; Irr-BCD: triangles; AGN: asterisks. Panel a): gas fraction (MHI/M∗) versus M∗. The diagonal dot-dashed line represents the limiting sensitivity of ALFALFA at the distance of Virgo. The black symbols give the representative – sample extracted from GASS by Catinella et al. (2010), the large magenta squares represent the HI-normal sample and the large red squares the Virgo sample from Cortese et al. (2011). Across the stellar mass range in common there is an almost perfect agreement, but the present sample extends the correlation to two orders of magnitude fainter. Panel b): SFR versus M∗. Panel c): specific SFR versus M∗. The blue and red solid lines reproduce the relations plotted in Fig. 8 of Schiminovich et al. (2010) for the star-forming sequence (blue) and the non-star forming locus of red galaxies (red).
Current usage metrics show cumulative count of Article Views (full-text article views including HTML views, PDF and ePub downloads, according to the available data) and Abstracts Views on Vision4Press platform.
Data correspond to usage on the plateform after 2015. The current usage metrics is available 48-96 hours after online publication and is updated daily on week days.
Initial download of the metrics may take a while.