Fig. 7
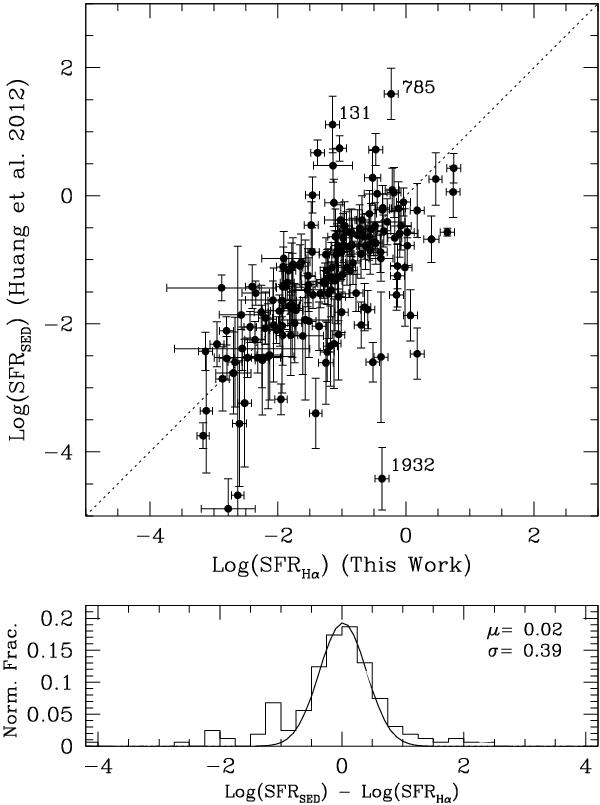
Top: correlation between the SFR used in this work (from Hα) and those adopted by Huan et al. (2012) (computed from SED fitting) The one-to-one relation is given with a dotted line. Some outliers marked with their VCC names are commented on in the text. Bottom: the distribution of the residual of the two star formation indicators, with a Gaussian of mean μ and σ fitted to it.
Current usage metrics show cumulative count of Article Views (full-text article views including HTML views, PDF and ePub downloads, according to the available data) and Abstracts Views on Vision4Press platform.
Data correspond to usage on the plateform after 2015. The current usage metrics is available 48-96 hours after online publication and is updated daily on week days.
Initial download of the metrics may take a while.