Fig. 5
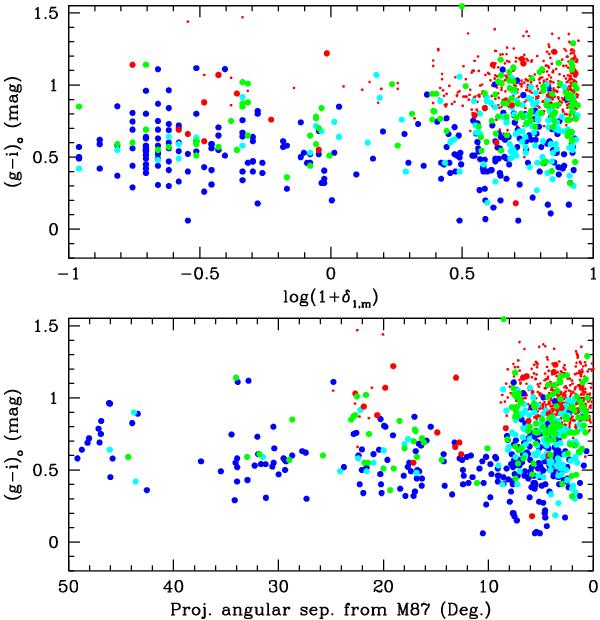
Corrected (g − i)o color of galaxies of all morphological types as a function of the local galaxy density (top panel) and of the projected angular separation from M 87 (bottom panel). HI-rich LTGs are depicted with blue symbols; HI-poor LTGs are plotted with cyan symbols; LTGs undetected by ALFALFA are given with green symbols; ETGs are marked with red symbols.
Current usage metrics show cumulative count of Article Views (full-text article views including HTML views, PDF and ePub downloads, according to the available data) and Abstracts Views on Vision4Press platform.
Data correspond to usage on the plateform after 2015. The current usage metrics is available 48-96 hours after online publication and is updated daily on week days.
Initial download of the metrics may take a while.