Fig. 10
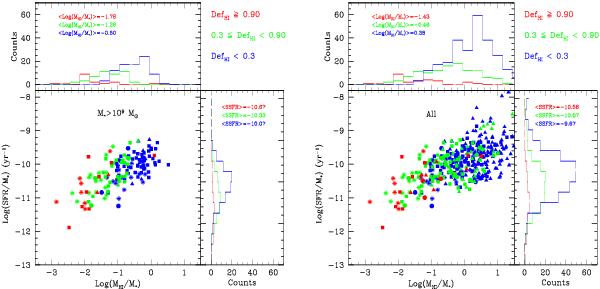
Left panel: relation between the specific star formation rate and the gas fraction in three classes of increasing DefHI, excluding objects fainter than M∗ = 109M⊙. Right panel: same as in the left panel, but including fainter objects. The histograms drawn on top and to the right show the counts of galaxies with given HI gas fraction and SSFR, with the mean values given in three bins of DefHI.
Current usage metrics show cumulative count of Article Views (full-text article views including HTML views, PDF and ePub downloads, according to the available data) and Abstracts Views on Vision4Press platform.
Data correspond to usage on the plateform after 2015. The current usage metrics is available 48-96 hours after online publication and is updated daily on week days.
Initial download of the metrics may take a while.