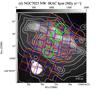
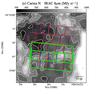
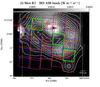
Fig. 1
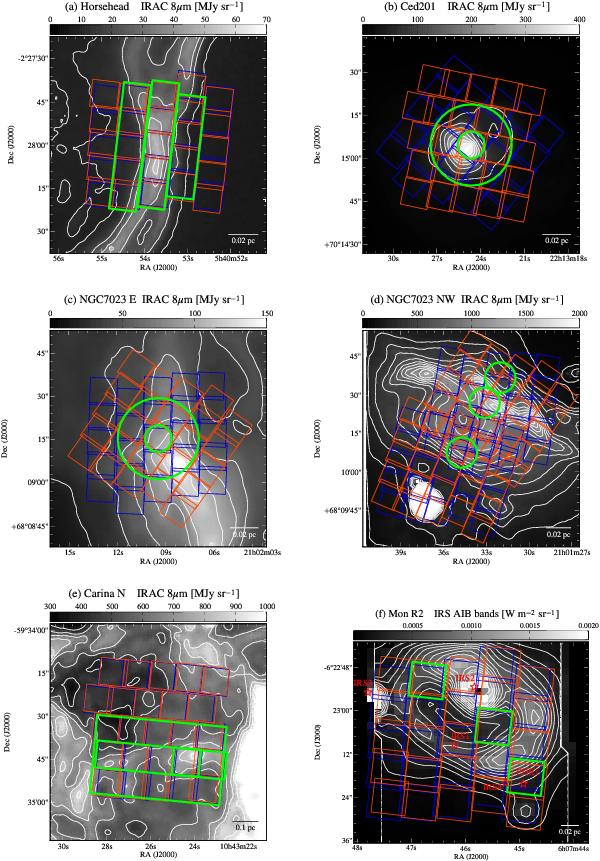
PACS footprints of the blue camera ([O i] 63 μm) and the red camera ([O i] 145 μm and [C ii] 158 μm) overlaid on IRAC 8 μm, except for f) Mon R2. (There IRAC 8 μm is saturated, and the total intensity of AIB bands derived from fitting of IRS spectra (see text) is shown.) Green circles or boxes show the areas from which our PACS and IRS spectra are extracted (subregions in Table 3). For Mon R2 f), the positions of four IR sources (IRS1−4) and PDR 1 from Berné et al. (2009) are marked.
Current usage metrics show cumulative count of Article Views (full-text article views including HTML views, PDF and ePub downloads, according to the available data) and Abstracts Views on Vision4Press platform.
Data correspond to usage on the plateform after 2015. The current usage metrics is available 48-96 hours after online publication and is updated daily on week days.
Initial download of the metrics may take a while.