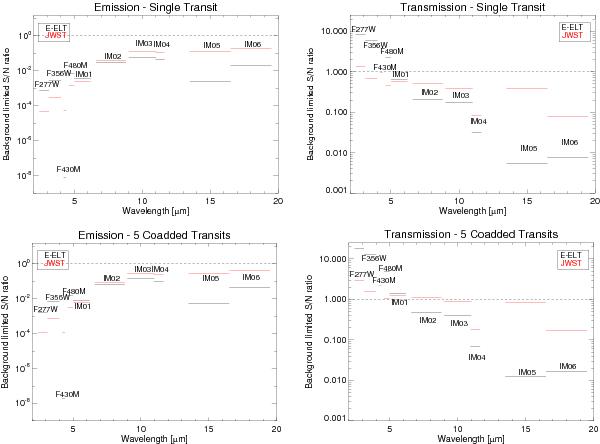
Fig. 7

Background limited S/Ns for secondary (right column) and primary transit observations (left column). The S/Ns for the central run of a planet orbiting a G-type star for two different telescope configurations are shown. The upper row shows S/Ns for one single transit observation, the lower row when co-adding five observations. The solid bars represent the filter bandpasses of NIRCam from 2 to 5 μm and of MIRI from 5 to 20 μm. Note that the F430M filter in transmission spectra is not visible due to a low S/N below 0.001.
Current usage metrics show cumulative count of Article Views (full-text article views including HTML views, PDF and ePub downloads, according to the available data) and Abstracts Views on Vision4Press platform.
Data correspond to usage on the plateform after 2015. The current usage metrics is available 48-96 hours after online publication and is updated daily on week days.
Initial download of the metrics may take a while.


