Free Access
Fig. 6
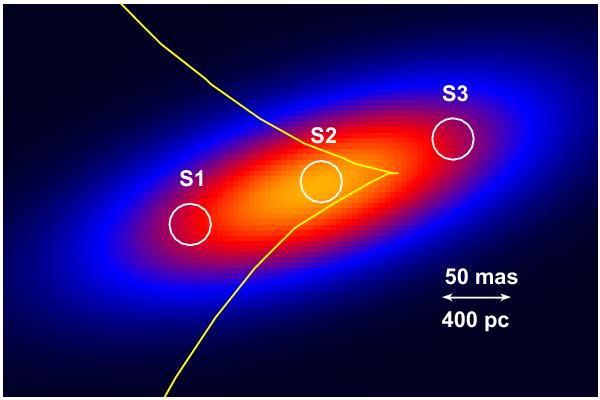
Color image representing the best-fit elliptical Gaussian source to the CO(7–6) emission. The yellow curve shows the caustic line derived from the lens model. To quantify the effect of differential magnification we considered three virtual sources. S1, S2, and S3 are magnified by 18.8, 39.3, and 13.8, respectively.
Current usage metrics show cumulative count of Article Views (full-text article views including HTML views, PDF and ePub downloads, according to the available data) and Abstracts Views on Vision4Press platform.
Data correspond to usage on the plateform after 2015. The current usage metrics is available 48-96 hours after online publication and is updated daily on week days.
Initial download of the metrics may take a while.