Fig. 1
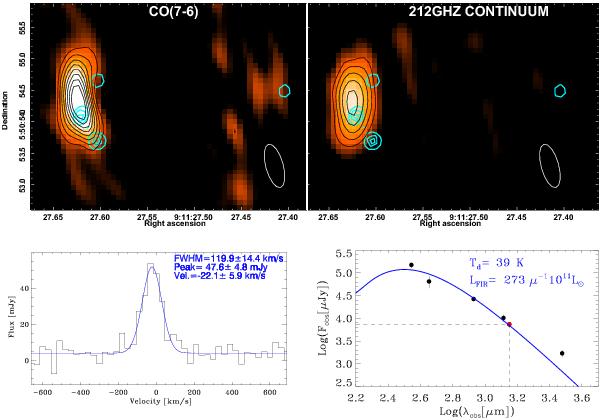
Upper left: CO(7–6) emission integrated over the velocity range [ − 120,60] km s-1. The black contour levels start at 3 × σ and are spaced by σ = 135 mJy beam-1 km s-1. The white ellipse at the bottom right represents the beam at half maximum (0.71′′ × 0.28′′). The HST map contours are overlaid in cyan. Upper right: the 212 GHz continuum map. The black contour levels start at 3 × σ and are spaced by σ = 0.28 mJy beam-1. Lower left: the CO(7–6) integrated spectrum with the best Gaussian fit overlaid. Lower right: best-fit modified black body spectral energy distribution to the FIR continuum measurements derived by Wu et al. (2009), Barvainis & Ivison (2002), and us (red dot at λ = 1.41 mm).
Current usage metrics show cumulative count of Article Views (full-text article views including HTML views, PDF and ePub downloads, according to the available data) and Abstracts Views on Vision4Press platform.
Data correspond to usage on the plateform after 2015. The current usage metrics is available 48-96 hours after online publication and is updated daily on week days.
Initial download of the metrics may take a while.