Fig. 3
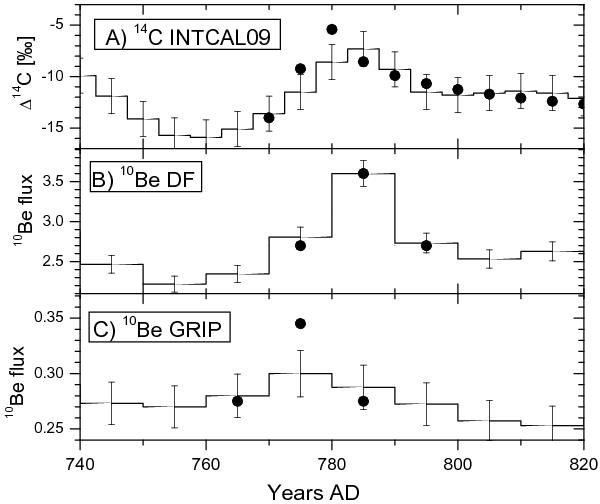
Time profiles of the measured cosmogenic isotopes (histograms with error bars) for the period around AD775. Solid dots represent the enhancement expected in each data series assuming the AD775 event scenario discussed here (14C production Q = 1.3 × 10⁸ at/cm2). A) INTCAL09 5-yr samples global atmospheric Δ14C (Reimer et al. 2009); B) quasi-decadal 10Be content in the Dome Fuji ice core (Horiuchi et al. 2008), our model data is shifted by 5 years to match the observed data; C) quasi-decadal 10Be content in the GRIP ice core (Yiou et al. 1997).
Current usage metrics show cumulative count of Article Views (full-text article views including HTML views, PDF and ePub downloads, according to the available data) and Abstracts Views on Vision4Press platform.
Data correspond to usage on the plateform after 2015. The current usage metrics is available 48-96 hours after online publication and is updated daily on week days.
Initial download of the metrics may take a while.