Free Access
Fig. 3
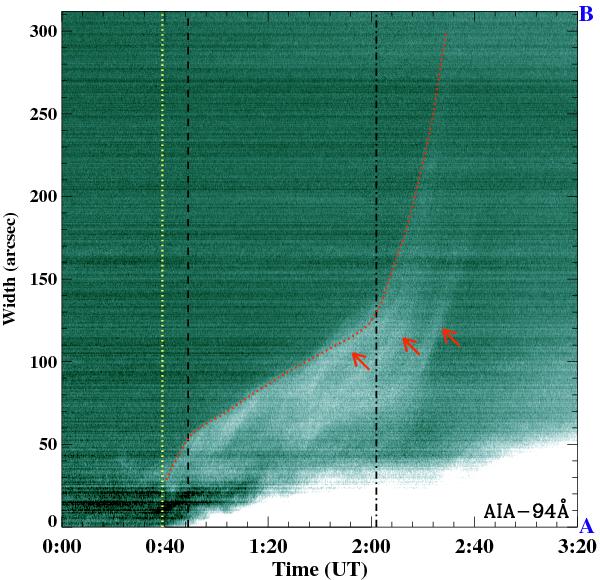
Time slice of a series of SDO/AIA 94 Å base difference images along the black line AB displayed in Fig. 2f. The red dotted curve marks the front of the erupting flux ropes. Three vertical lines separate the three phases of the eruptions, and the three red arrows denote the flux ropes.
Current usage metrics show cumulative count of Article Views (full-text article views including HTML views, PDF and ePub downloads, according to the available data) and Abstracts Views on Vision4Press platform.
Data correspond to usage on the plateform after 2015. The current usage metrics is available 48-96 hours after online publication and is updated daily on week days.
Initial download of the metrics may take a while.