Fig. 2
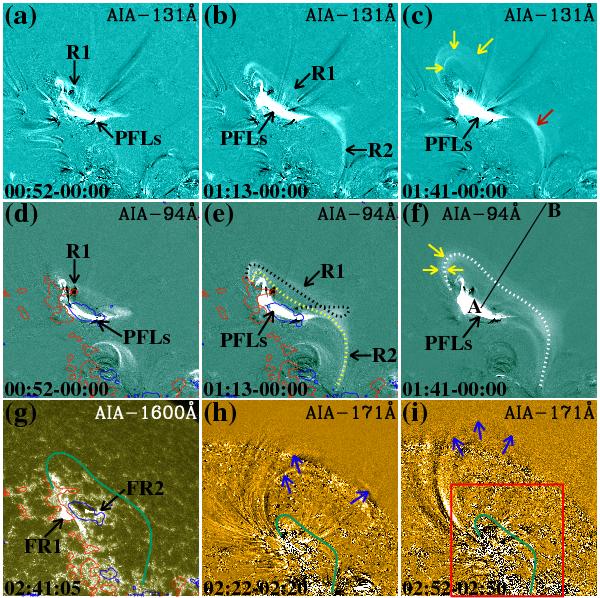
Time series of SDO/AIA 131 Å (a–c) and 94 Å (d–f) base difference images displaying eruptions of the two flux ropes R1 and R2. An AIA 1600 Å image (g) illustrating two flare ribbons, FR1 and FR2, and two AIA 171 Å running difference images (h–i), showing the flux loop expansion. PFLs represents post-flare loops, and blue and red contours the LOS magnetic flux densities of –150 G and 150 G. The yellow arrows in c) and f) denote flux ropes, the red arrow in c) marks twisted structures, and blue arrows in h)–i) indicates the expansion. The curves in e)–i) mark flux ropes, and the black line AB in f) the position for time slice evolution displayed in Fig. 3. The FOV of h)–i) is 420′′ × 420′′. The red window in i) represents the FOV of a)–g), 240′′ × 240′′.
Current usage metrics show cumulative count of Article Views (full-text article views including HTML views, PDF and ePub downloads, according to the available data) and Abstracts Views on Vision4Press platform.
Data correspond to usage on the plateform after 2015. The current usage metrics is available 48-96 hours after online publication and is updated daily on week days.
Initial download of the metrics may take a while.