Fig. 1
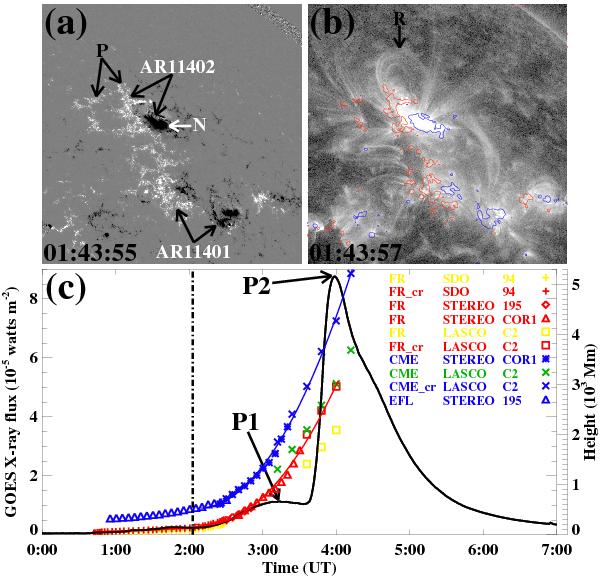
SDO/HMI LOS magnetogram a) and SDO/AIA 131 Å image b) showing the AR information. N in a) indicates a negative sunspot, P in a) diffused positive magnetic fields, blue and red contours in b) the LOS magnetic flux densities of –200 G and 200 G, and R in b) flux ropes. The field of view (FOV) is 310′′ × 310′′. c) The GOES-15 1–8 Å soft X-ray flux (the black solid curve). P1 and P2 mark two peaks. The colored signs represent the heights of the flux ropes and CME (see text for details), and the red and blue lines denote the second-order polynomial fits to CME bright core and front. FR represents the flux ropes and EFL the expanding flux loops. The terms with “cr” mean the heights after correction for the projection effect.
Current usage metrics show cumulative count of Article Views (full-text article views including HTML views, PDF and ePub downloads, according to the available data) and Abstracts Views on Vision4Press platform.
Data correspond to usage on the plateform after 2015. The current usage metrics is available 48-96 hours after online publication and is updated daily on week days.
Initial download of the metrics may take a while.