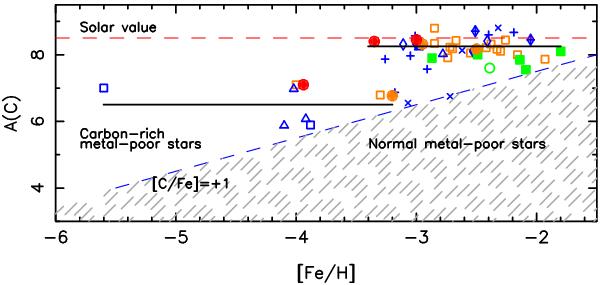
Fig. 14

Abundance of carbon A(C) vs. [Fe/H] in dwarfs and turnoff CEMP stars, following Sivarani et al. (2006, their Table 4), [orange open squares]), Frebel et al. (2005, 2007) [blue open squares], Thompson et al. (2008) [green open circle], Aoki et al. (2009) [blue open diamonds], Behara et al. (2010) [full orange circles], Placco et al. (2011) [blue ×), Carollo et al. (2011) [blue +], Masseron et al. (2010, 2012) [full green squares], Yong et al. (2013b) [blue open triangles]. Our measurements are represented with full red circles. The dashed blue line (representing [C/Fe] = +1) separates the region of the carbon-rich metal-poor stars from the region of the normal metal-poor stars (hatched). When [Fe/H] is higher than –3 the carbon abundance is almost constant and close to 8.25 (see also Masseron et al. 2010). For [Fe/H] < −3.4 the carbon abundance drops suddenly to about 6.5. However, it is difficult to decide whether at very low metallicity A(C) is also constant, or whether the line A(C)= 6.5 represents an upper limit of the carbon abundance in these extremely metal-poor star (Masseron et al. 2010).
Current usage metrics show cumulative count of Article Views (full-text article views including HTML views, PDF and ePub downloads, according to the available data) and Abstracts Views on Vision4Press platform.
Data correspond to usage on the plateform after 2015. The current usage metrics is available 48-96 hours after online publication and is updated daily on week days.
Initial download of the metrics may take a while.


