Fig. 2
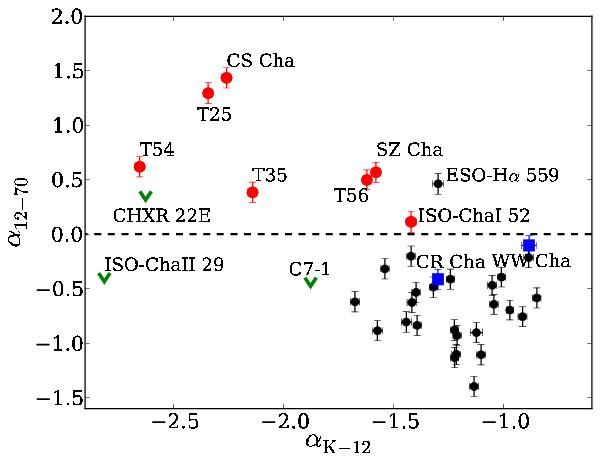
SED slope between the 12 and 70 μm (α12−70) as a function of the SED slope between the Ks-band and 12 μm (αKs − 12). Transitional disks from the literature meeting the selection criterion are marked as red dots, green downward arrows are those for which only upper limits could be estimated. Class II objects are black dots. Blue squares are pretransitional disks from Espaillat et al. (2011). There is a clear separation between Class II and transitional disks due to the different shape of their SED. The single black dot with α > 0 is ESO-Hα 559, an edge-on disk. This diagram shows the potential for transitional disk classification using the 70 μm band.
Current usage metrics show cumulative count of Article Views (full-text article views including HTML views, PDF and ePub downloads, according to the available data) and Abstracts Views on Vision4Press platform.
Data correspond to usage on the plateform after 2015. The current usage metrics is available 48-96 hours after online publication and is updated daily on week days.
Initial download of the metrics may take a while.