Free Access
Fig. 7
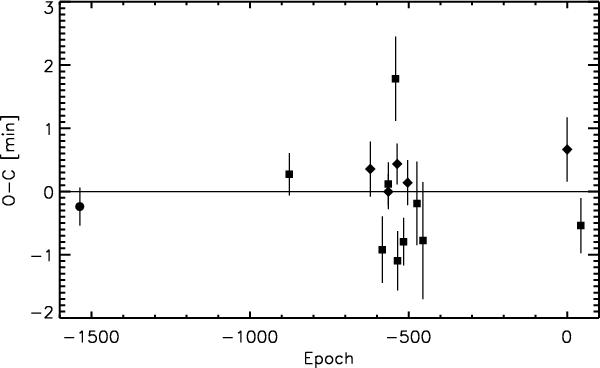
O–C deviations of the individual transits from the ephemeris given in Table 2. The filled circle represents the FTS transit of Hebb et al. (2010), the squares represent data obtained with EulerCam, and the diamonds represent data from TRAPPIST.
Current usage metrics show cumulative count of Article Views (full-text article views including HTML views, PDF and ePub downloads, according to the available data) and Abstracts Views on Vision4Press platform.
Data correspond to usage on the plateform after 2015. The current usage metrics is available 48-96 hours after online publication and is updated daily on week days.
Initial download of the metrics may take a while.