Fig. 1
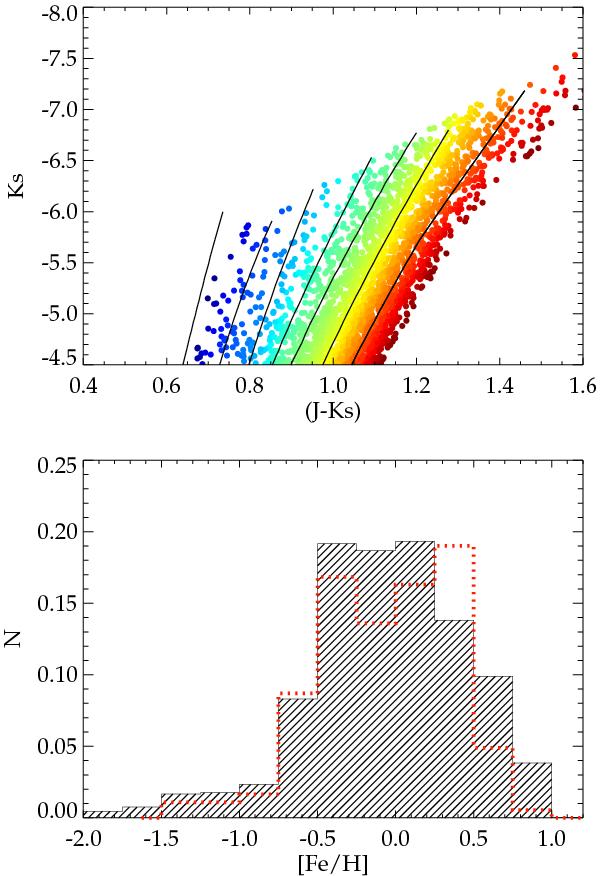
CMD of the Galactic bulge in Baade’s window (30′ × 30′) in the selected upper RGB region, used for the interpolation routine. Stars are color coded acording to their individual metallicities. Lower panel shows the metallicity distribution for the same region, compared to that from high-resolution spectroscopy from Hill et al. (2011), shown in red.
Current usage metrics show cumulative count of Article Views (full-text article views including HTML views, PDF and ePub downloads, according to the available data) and Abstracts Views on Vision4Press platform.
Data correspond to usage on the plateform after 2015. The current usage metrics is available 48-96 hours after online publication and is updated daily on week days.
Initial download of the metrics may take a while.