Fig. 7
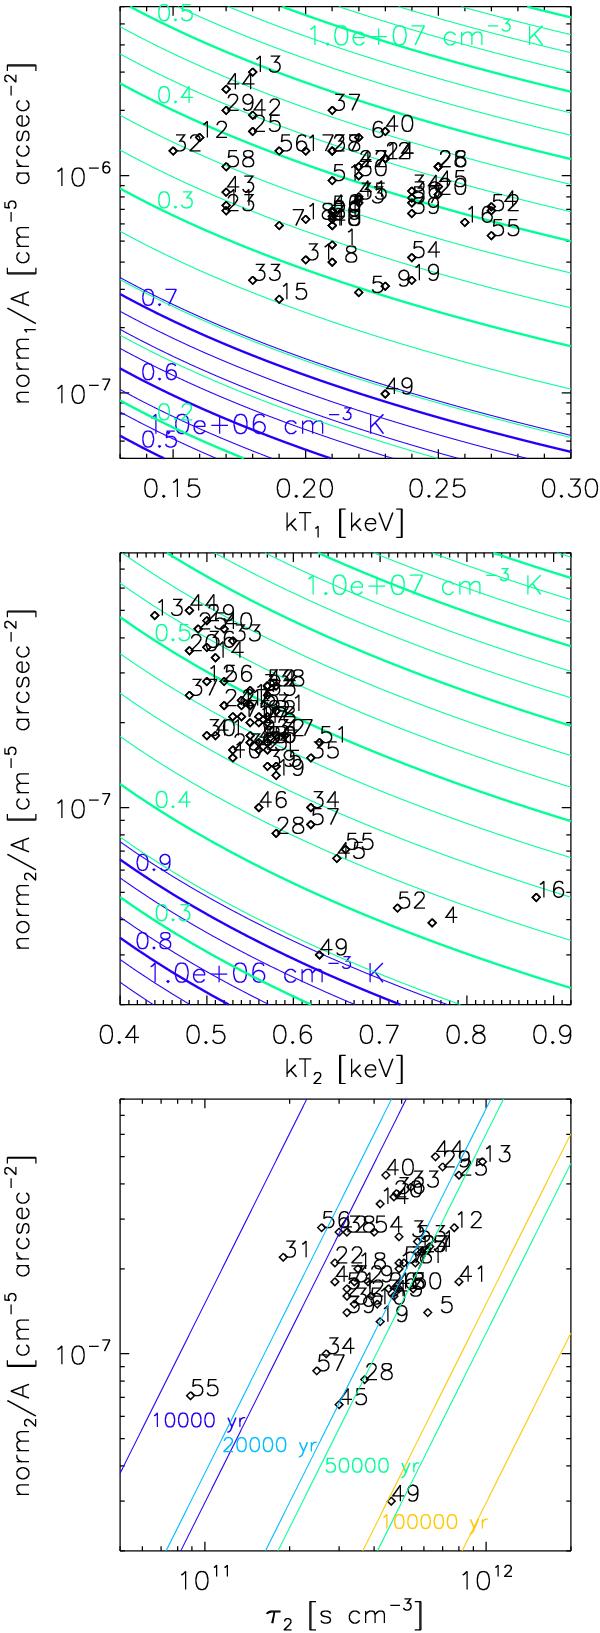
Distribution of the parameter values for the fit with two VNEI components. The labels of the data points are region numbers. The lines in the diagrams for surface brightness norm1,2/A against temperature kT1,2 (upper and middle panels) show the isobars for p/k = 106 cm-3 K (blue) and 107 cm-3 K (green) for different values of the filling factors in the remnant and the size of the emitting volume along the line of sight. The line for each filling factor with the lowest norm1,2/A are marked with a thicker line and labelled with the f1,2 value. The lines in the diagram showing the surface brightness as norm2/A against the ionisation timescale τ2 (bottom panel) are isochrones for t = 10 000, 20 000, 50 000, and 100 000 yr. A range for all isochrones is shown for each t covering the range of variation in the depth of the emitting volume.
Current usage metrics show cumulative count of Article Views (full-text article views including HTML views, PDF and ePub downloads, according to the available data) and Abstracts Views on Vision4Press platform.
Data correspond to usage on the plateform after 2015. The current usage metrics is available 48-96 hours after online publication and is updated daily on week days.
Initial download of the metrics may take a while.