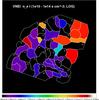
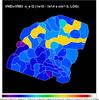
Fig. 6
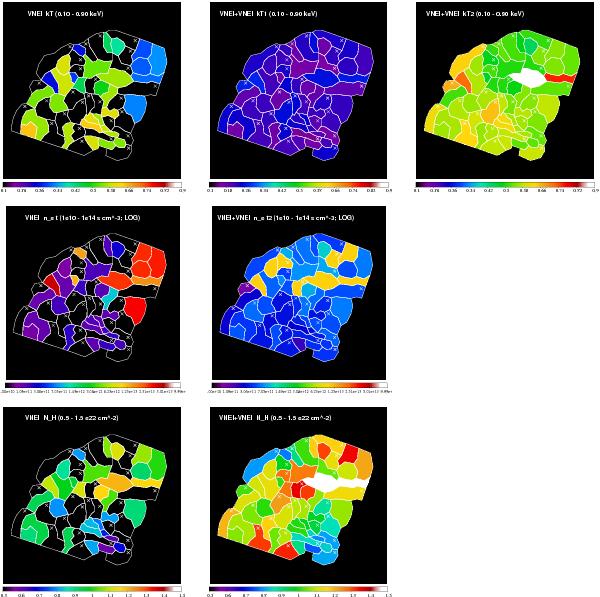
Top: best fit temperature parameters for the one-component VNEI model (kT) in regions in which the F-test indicated that the one-component model fits the spectrum sufficiently well (left) and temperature parameters kT1 and kT2 for the two-component fits for all regions (middle and right, respectively). Middle: best fit values for the ionisation timescale τ for the one-component VNEI model (left) and the ionisation timescale τ2 for the dominating ejecta component for the two-component fits (right). Bottom: best fit values for the foreground NH for the one-component VNEI model (left) and for the two-component fits (right). The crosses mark the regions in which the F-test indicated that the two-VNEI component model yields a better fit (see Sect. 2.2.3).
Current usage metrics show cumulative count of Article Views (full-text article views including HTML views, PDF and ePub downloads, according to the available data) and Abstracts Views on Vision4Press platform.
Data correspond to usage on the plateform after 2015. The current usage metrics is available 48-96 hours after online publication and is updated daily on week days.
Initial download of the metrics may take a while.