Fig. 10
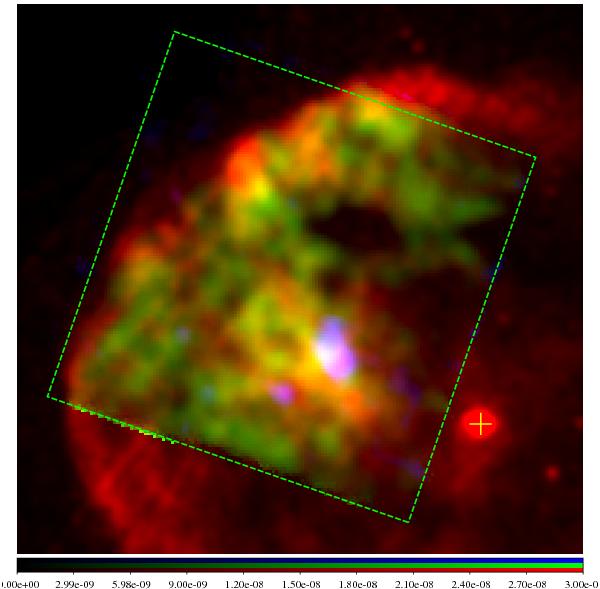
Three-colour image consisting of a red image for the soft band XMM-Newton image (0.3−0.9 keV, Sasaki et al. 2004), a green image for Mg (1.25−1.45 keV) – continuum, and a blue image for Si (1.7−2.1 keV) – continuum. The Mg and Si images were created from the Chandra data. The green dashed box indicates the field of view of the Chandra ACIS-I. The yellow cross indicates the present position of the AXP 1E 2259+586.
Current usage metrics show cumulative count of Article Views (full-text article views including HTML views, PDF and ePub downloads, according to the available data) and Abstracts Views on Vision4Press platform.
Data correspond to usage on the plateform after 2015. The current usage metrics is available 48-96 hours after online publication and is updated daily on week days.
Initial download of the metrics may take a while.