Fig. 7
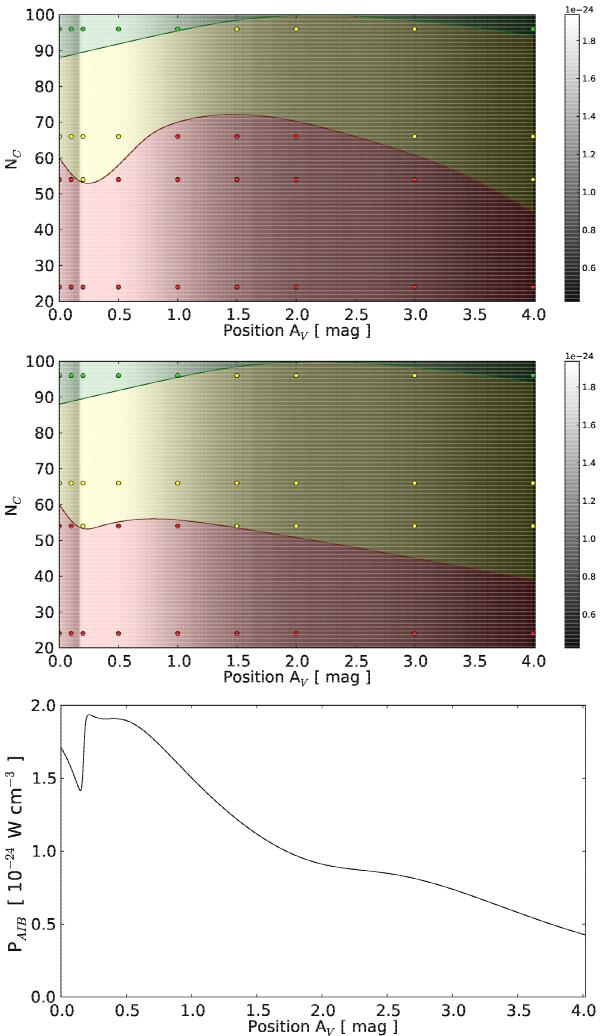
Dominant hydrogenation state as a function of PAH size and position in the NGC 7023 NW PDR, without reactivity (upper panel) or with a rate of 5 × 10-13 cm3 s-1 (middle panel) for the reaction between PAH cations and H2. The points represent the parameters for which models were computed. Red, yellow, and green represent carbon clusters, normally hydrogenated PAHs, and superhydrogenated PAHs (limited to one extra H-atom), respectively. Lines delimiting the different domains were interpolated to guide the eye and should be considered with caution. The power per unit of volume PAIB emitted in the mid-IR domain by PAHs and carbon clusters as a function of their position is shown in the lower panel, and is also overlaid as a brightness scale to the upper and middle panels. The variation observed between AV = 0 and 0.2 reflects the variation of nH (see Fig. 2).
Current usage metrics show cumulative count of Article Views (full-text article views including HTML views, PDF and ePub downloads, according to the available data) and Abstracts Views on Vision4Press platform.
Data correspond to usage on the plateform after 2015. The current usage metrics is available 48-96 hours after online publication and is updated daily on week days.
Initial download of the metrics may take a while.