Free Access
Fig. 9
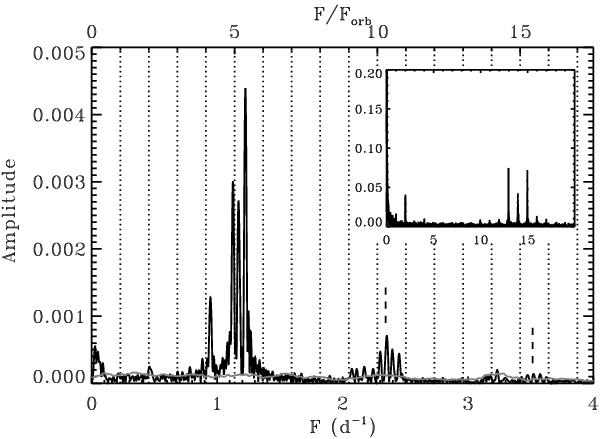
Final amplitude spectrum of CoRoT 102918586 and, in the inset, the window DFT. The vertical dotted lines correspond to the orbital period overtones, the broken lines to 2F3 and 3F3. The gray line is the threshold of significance (S/N ≥ 4) computed as explained in the text.
Current usage metrics show cumulative count of Article Views (full-text article views including HTML views, PDF and ePub downloads, according to the available data) and Abstracts Views on Vision4Press platform.
Data correspond to usage on the plateform after 2015. The current usage metrics is available 48-96 hours after online publication and is updated daily on week days.
Initial download of the metrics may take a while.