Fig. 3
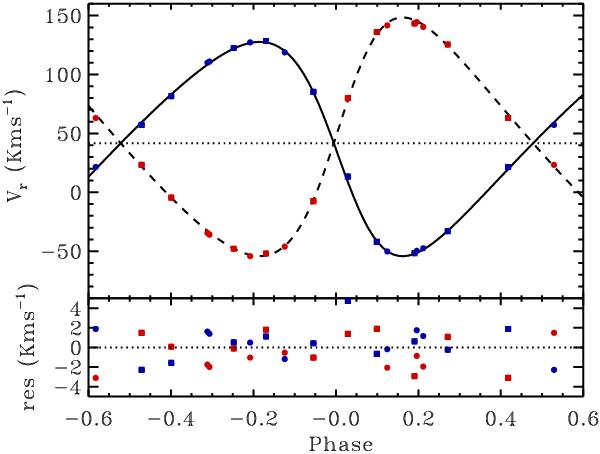
Upper panel: phased radial velocity curves of CoRoT 102918586 components. Filled circles are FEROS measurements, filled squares Sandiford data; uncertainties are smaller than the symbol size; continuous line is the best-fit radial velocity curve obtained with PHOEBE for the primary component, dashed line for the secondary component. Lower panel: fit residuals, with the same symbols.
Current usage metrics show cumulative count of Article Views (full-text article views including HTML views, PDF and ePub downloads, according to the available data) and Abstracts Views on Vision4Press platform.
Data correspond to usage on the plateform after 2015. The current usage metrics is available 48-96 hours after online publication and is updated daily on week days.
Initial download of the metrics may take a while.