Fig. 1
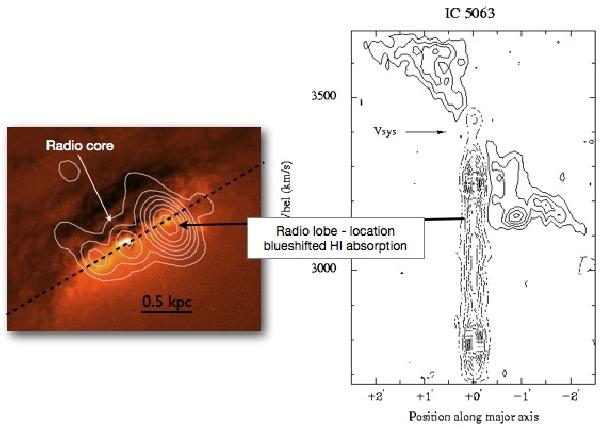
Some relevant characteristics of IC 5063 (taken from Morganti et al. 1998). Left: the morphology of the radio continuum emission (white contours) is superimposed on an HST image. The contours show the bright radio lobe (the W component), the core, and the fainter E lobe. The APEX CO(2–1) observation is centered on the radio core but with a beam of 30′′, it covers the entire radio source. The right figure illustrates the H I position-velocity plot taken along the major axis of the H I disk (black dashed line on the radio image). The large-scale H I disk in emission is shown with solid contours while the broad blueshifted component detected in absorption (dashed contours) is clearly evident, covering velocities well outside the range of the normal gas disk (Morganti et al. 1997). The spatial axis in this plot covers the galaxy out to 2.5 arcmin radius. VLBI follow-up H I observations have shown that the blueshifted absorption is located at the position of the western brighter radio lobe, about 0.5 kpc from the nucleus, suggesting that the jet-ISM interaction occurs at this location (Oosterloo et al. 2000).
Current usage metrics show cumulative count of Article Views (full-text article views including HTML views, PDF and ePub downloads, according to the available data) and Abstracts Views on Vision4Press platform.
Data correspond to usage on the plateform after 2015. The current usage metrics is available 48-96 hours after online publication and is updated daily on week days.
Initial download of the metrics may take a while.