Fig. 9
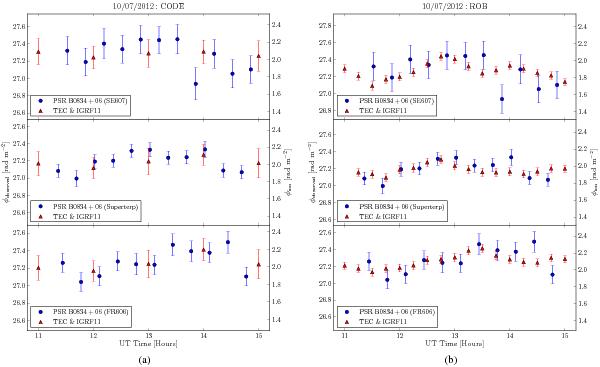
Observed Faraday depths, φobserved, and ionFR-modeled ionospheric Faraday depths, φion, toward B0834+06 as a function of time during midday (observations: blue circles, left axis labels; model: red triangles, right axis labels). Upper panels: eleven LOFAR HBA observations using the international station near Onsala, Sweden. Middle panels: eleven LOFAR Superterp HBA observations. Lower panels: eleven LOFAR HBA observations using the international station near Nançay, France. Panel a) shows the ionFR model using CODE TEC data and IGRF11; panel b) shows the ionFR model using ROB TEC data and IGRF11.
Current usage metrics show cumulative count of Article Views (full-text article views including HTML views, PDF and ePub downloads, according to the available data) and Abstracts Views on Vision4Press platform.
Data correspond to usage on the plateform after 2015. The current usage metrics is available 48-96 hours after online publication and is updated daily on week days.
Initial download of the metrics may take a while.