Fig. 5
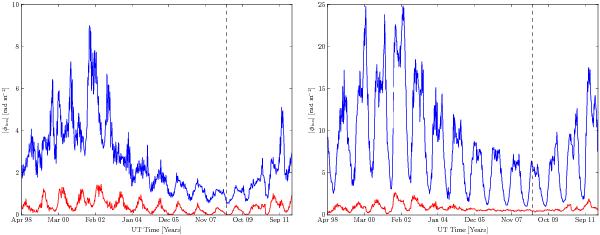
Weekly averages of the maximum and minimum (blue and red lines, respectively) absolute ionospheric Faraday depth | φion | from April 1998–2012, as modeled by ionFR. The absolute value is shown because the ionospheric Faraday depth is positive or negative if observing from the northern or southern hemisphere, respectively. The dashed vertical lines represent the end of Solar Cycle 23 (December 2008) and beginning of the current Solar Cycle 24. Left: toward CasA, as viewed from LOFAR. Right: toward Eta Carinae, as viewed from an average of the SKA core sites in Western Australia and South Africa.
Current usage metrics show cumulative count of Article Views (full-text article views including HTML views, PDF and ePub downloads, according to the available data) and Abstracts Views on Vision4Press platform.
Data correspond to usage on the plateform after 2015. The current usage metrics is available 48-96 hours after online publication and is updated daily on week days.
Initial download of the metrics may take a while.