Fig. 2
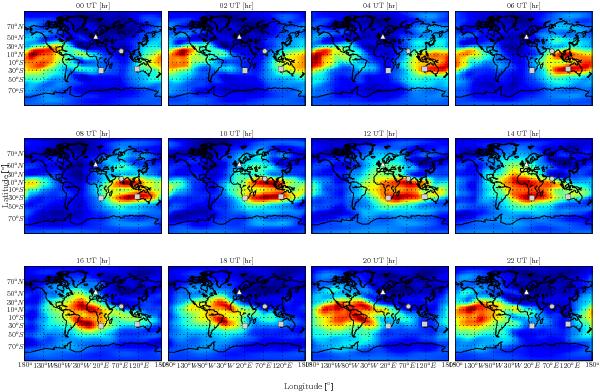
GIMs representing the VTEC across the globe for April 11th, 2011 (the date of the first LOFAR observing campaign, see Sect. 5) obtained courtesy of CODE. The maps range from minimum (blue) to maximum (red) VTEC values of 0.0–87.2 TECU (1 TECU = 1016 electrons/m2). The triangles indicate the location of the LOFAR core stations in the Netherlands, the squares mark the SKA core sites in South Africa and Western Australia, and the circles indicate the site of the GMRT.
Current usage metrics show cumulative count of Article Views (full-text article views including HTML views, PDF and ePub downloads, according to the available data) and Abstracts Views on Vision4Press platform.
Data correspond to usage on the plateform after 2015. The current usage metrics is available 48-96 hours after online publication and is updated daily on week days.
Initial download of the metrics may take a while.