Fig. 8
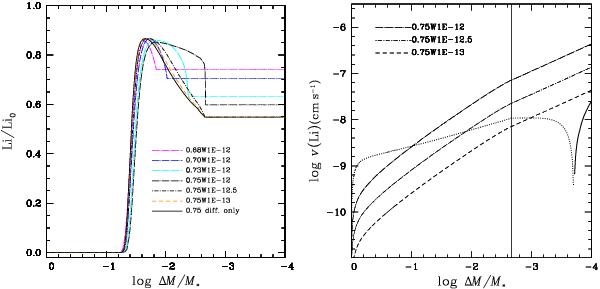
(Left panel) Internal lithium profiles for 0.75 M⊙ models with and without mass loss. Three models of different masses were added (colored curves) in order to verify the solution for the 0.75W1E-12 model. (Right panel) A comparison of diffusion (dotted and solid lines) and wind velocities (dashed lines identified in the figure) for the 0.75 M⊙ models. The vertical solid line identifies the bottom of the surface convection zone. All models are shown at 10 Gyr. The left panel can be compared to Fig. 4 of Vauclair & Charbonnel (1995).
Current usage metrics show cumulative count of Article Views (full-text article views including HTML views, PDF and ePub downloads, according to the available data) and Abstracts Views on Vision4Press platform.
Data correspond to usage on the plateform after 2015. The current usage metrics is available 48-96 hours after online publication and is updated daily on week days.
Initial download of the metrics may take a while.