Fig. 1
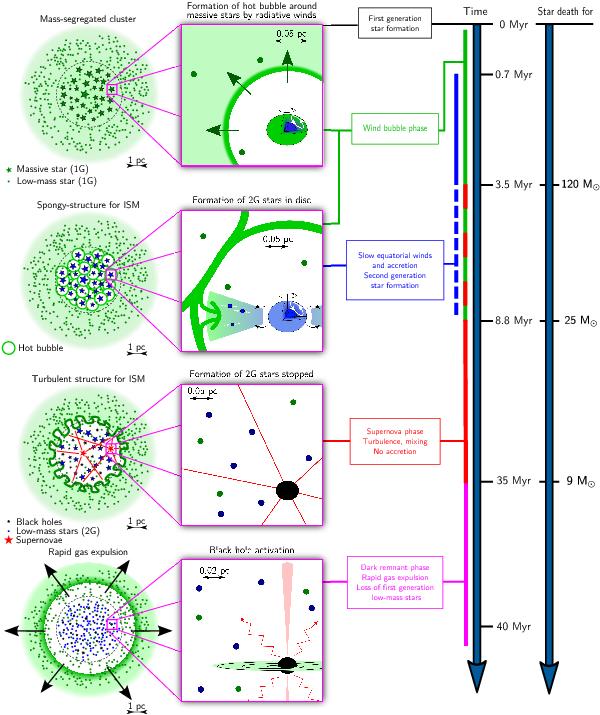
Sketch of the proposed model for the first 40 Myr of evolution of a two-population globular cluster together with the global timeline (top to bottom) and the associated time when the stellar life ends for selected stars on the right. The leftmost column shows the whole cluster. The second column from the left represents a zoom on an FRMS. Four important stages are depicted. First row from top: first a mass-segregated star cluster is formed with all FRMS inside the half-mass radius (dashed line) and with the initial gas (light pistachio-green shade) remaining after the star formation. Each massive star (the blue interior signifies the convective hydrogen burning core, the bright forest-green envelope depicts the convective envelope, which still has the pristine composition at this stage) creates a hot bubble around it. The corresponding wind shell is shown in a darker shade of green than the uncompressed gas. Second row: all hot bubbles connect and create a spongy structure in the centre. At the same time, slow mechanical winds around the FRMS create a disk around them. The outer envelope of the FRMS is now blue to denote that it has been contaminated by hydrogen-burning products. In the interaction between the ejected disc (blue) and the accreting ISM (green), a second generation of chemically different stars is born (blue filled circles). Third row: SNe (red stars with straight lines) fail to eject the gas but create a highly turbulent convection zone. Additional accretion onto the remaining FRMS discs is inhibited. The equatorial ejections also end around this time and the formation of the second-generation stars is completed by about 10 Myr on the global time axis. Bottom row: subsequently, rapid gas expulsion takes place and removes the remaining gas together with the majority of the less tightly bound first-generation stars out of the cluster potential well. Such a rapid gas expulsion is likely to be caused by the activation of black holes by accretion of matter.
Current usage metrics show cumulative count of Article Views (full-text article views including HTML views, PDF and ePub downloads, according to the available data) and Abstracts Views on Vision4Press platform.
Data correspond to usage on the plateform after 2015. The current usage metrics is available 48-96 hours after online publication and is updated daily on week days.
Initial download of the metrics may take a while.