Fig. 7
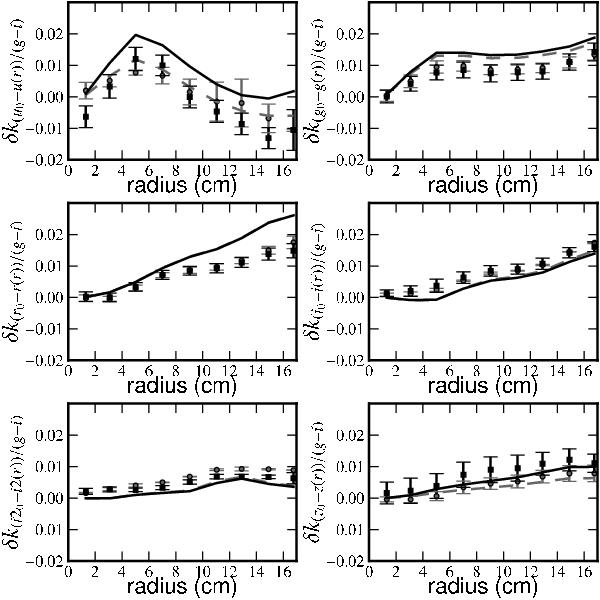
Difference between measured and modeled color terms (relating the natural and reference photometric system) as a function of radius. Solid points show the average value of the  map in bins of radius. We plot separately the value average on all epochs of the winter field (gray dots) and summer field (black squares). The error bars are estimated from the dispersion between epochs. Data points are not independent, and the error is dominated by the uncertainty on the overall normalization of the curve due to the constraint
  . The synthetic color terms are computed on reddened spectra from the Pickles stellar library, to reflect the effect of the extinction measured in the two fields.
Current usage metrics show cumulative count of Article Views (full-text article views including HTML views, PDF and ePub downloads, according to the available data) and Abstracts Views on Vision4Press platform.
Data correspond to usage on the plateform after 2015. The current usage metrics is available 48-96 hours after online publication and is updated daily on week days.
Initial download of the metrics may take a while.