Fig. 5
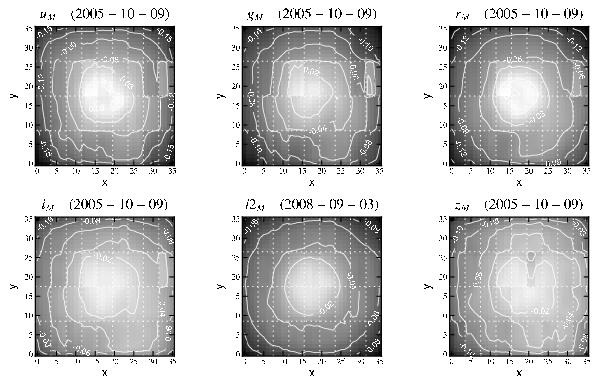
Maps of photometric corrections (relative to the twilight flat-field). Each panel displays a low resolution map (36 × 36 super-pixels of 256 × 256 real pixels, i.e. a resolution of about 2′) of the  corrections. Those corrections are determined on dithered observations of dense stellar fields in a given photometric band. Observations for the corrections displayed in uMgMrMiM and zM panels have been obtained during the same night in 2005 under remarkably stable atmospheric conditions. The i2M panel displays the result of an observation taken in 2008, about 1 year after the replacement of the iM filter. CCD boundaries are figured by white dotted lines.
Current usage metrics show cumulative count of Article Views (full-text article views including HTML views, PDF and ePub downloads, according to the available data) and Abstracts Views on Vision4Press platform.
Data correspond to usage on the plateform after 2015. The current usage metrics is available 48-96 hours after online publication and is updated daily on week days.
Initial download of the metrics may take a while.