Free Access
Fig. 4
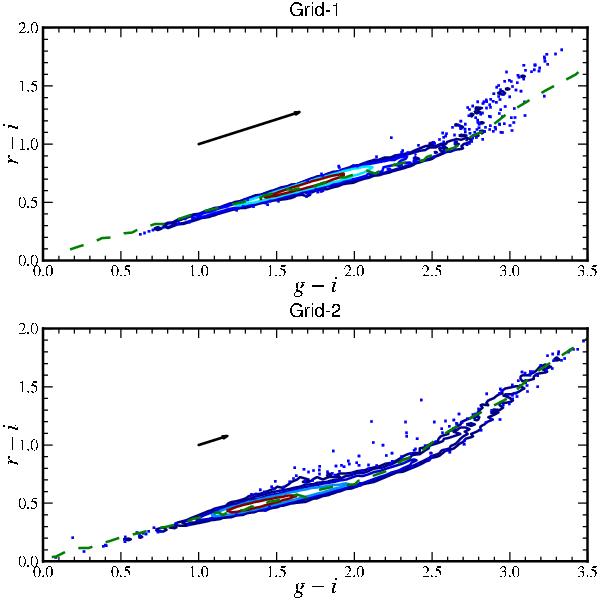
Stellar population within the two grid fields. The green dashed line is a synthetic stellar locus computed from the Pickles stellar library. Spectra have been reddened to match the average extinction measured in the field. The black arrow shows the corresponding extinction vector.
Current usage metrics show cumulative count of Article Views (full-text article views including HTML views, PDF and ePub downloads, according to the available data) and Abstracts Views on Vision4Press platform.
Data correspond to usage on the plateform after 2015. The current usage metrics is available 48-96 hours after online publication and is updated daily on week days.
Initial download of the metrics may take a while.