Free Access
Fig. 23
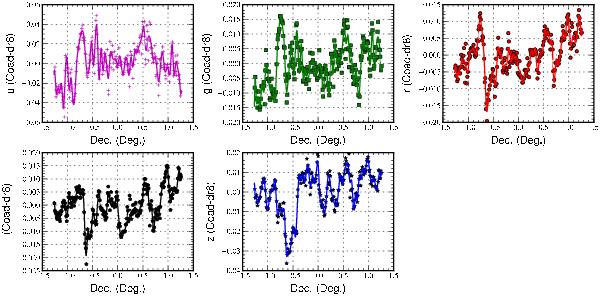
Difference between the coadd catalog and DR8 as a function of declination. The symbols represent the binned data and the lines are a cubic spline function fit to the data with 71 control points.
Current usage metrics show cumulative count of Article Views (full-text article views including HTML views, PDF and ePub downloads, according to the available data) and Abstracts Views on Vision4Press platform.
Data correspond to usage on the plateform after 2015. The current usage metrics is available 48-96 hours after online publication and is updated daily on week days.
Initial download of the metrics may take a while.