Free Access
Fig. 20
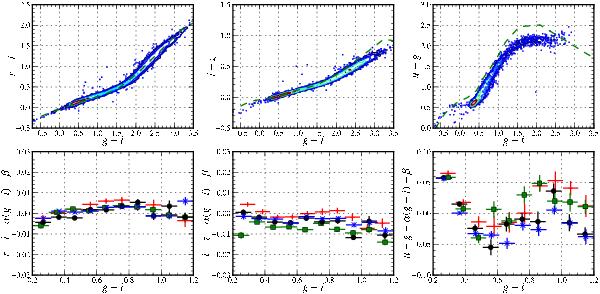
Top: color−color diagram of the 4 SNLS tertiary star catalogs. Bottom: residuals to a linear fit of the average stellar locus in the range 0.2 < g − i < 1.2. The residuals for the 4 deep fields are displayed separately (D1: red crosses, D2: green squares, D3: black circles, D4: blue asterisks).
Current usage metrics show cumulative count of Article Views (full-text article views including HTML views, PDF and ePub downloads, according to the available data) and Abstracts Views on Vision4Press platform.
Data correspond to usage on the plateform after 2015. The current usage metrics is available 48-96 hours after online publication and is updated daily on week days.
Initial download of the metrics may take a while.