Fig. 19
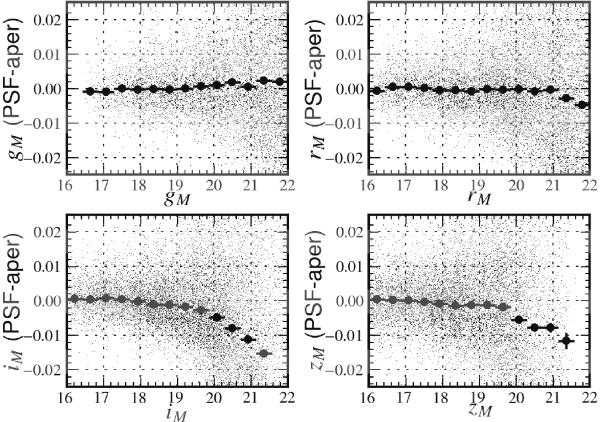
Difference between PSF and aperture photometry for tertiary stars as a function of star magnitudes (with the chromatic trend from Fig. 18 and the average background contamination of apertures subtracted). Black circles display the average of data points in bins of magnitudes. Averages are computed with a clipping at 2.5σ as used in the calibration of SNLS supernovae light-curves (Guy et al. 2010).
Current usage metrics show cumulative count of Article Views (full-text article views including HTML views, PDF and ePub downloads, according to the available data) and Abstracts Views on Vision4Press platform.
Data correspond to usage on the plateform after 2015. The current usage metrics is available 48-96 hours after online publication and is updated daily on week days.
Initial download of the metrics may take a while.