Free Access
Fig. 12
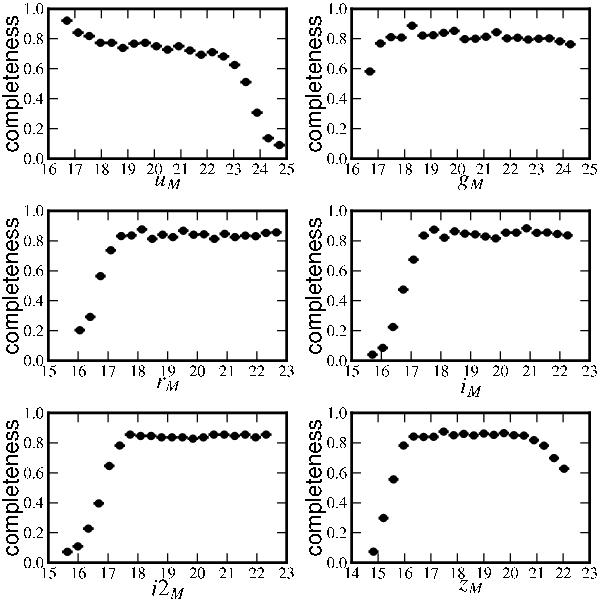
Measurement completeness in the tertiary star catalogs. Each plot displays the ratio of selected measurements to the number of exposures as a function of the star magnitude in each band. The plateau at ~85% reflects mostly the ratio of the usable area in the focal plane to the total area covered by the catalog.
Current usage metrics show cumulative count of Article Views (full-text article views including HTML views, PDF and ePub downloads, according to the available data) and Abstracts Views on Vision4Press platform.
Data correspond to usage on the plateform after 2015. The current usage metrics is available 48-96 hours after online publication and is updated daily on week days.
Initial download of the metrics may take a while.