Free Access
Fig. 11
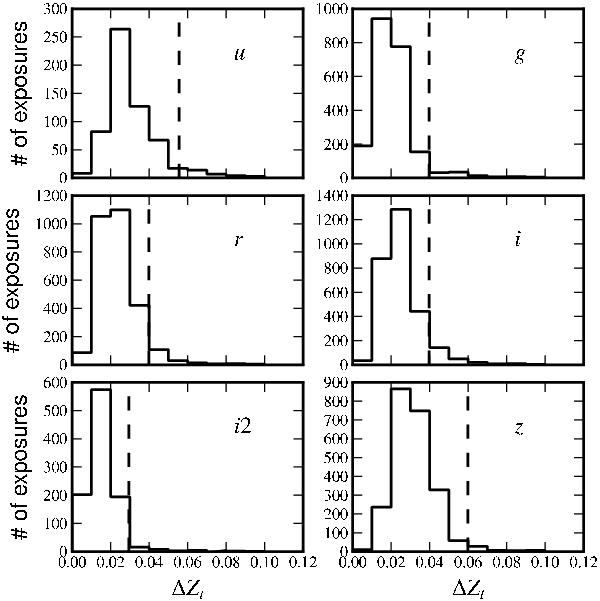
Distribution of the peak-to-peak zero point variation across the focal plane. Exposures displaying a peak-to-peak variation greater than 3% (6% in uM and zM) are discarded from the averaging. Vertical dashed lines show the cuts applied in the averaging process.
Current usage metrics show cumulative count of Article Views (full-text article views including HTML views, PDF and ePub downloads, according to the available data) and Abstracts Views on Vision4Press platform.
Data correspond to usage on the plateform after 2015. The current usage metrics is available 48-96 hours after online publication and is updated daily on week days.
Initial download of the metrics may take a while.