Fig. 10
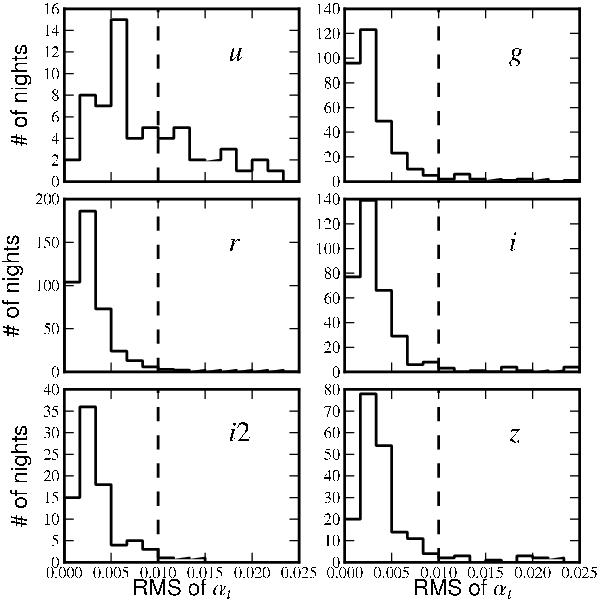
Top panel: distribution of zero point variations during an observation sequence (typically 6 exposures of 220 s in the same band in a row). Nights displaying a variability larger than 1% are discarded from the averaging. While the plot is cut at 0.025, numerous sequences (about 20%) taken under non-photometric conditions display a much larger variation. The zero point is defined as  .
.
Current usage metrics show cumulative count of Article Views (full-text article views including HTML views, PDF and ePub downloads, according to the available data) and Abstracts Views on Vision4Press platform.
Data correspond to usage on the plateform after 2015. The current usage metrics is available 48-96 hours after online publication and is updated daily on week days.
Initial download of the metrics may take a while.