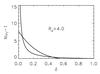
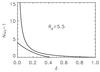
Fig. 2

Determination of the thickness δ of the stagnant zone, (example for Ra ∗ = 107, Le = 0.01, Pr = 0.1). The steep curve shows the heat flux in the stagnant zone as a function of the assumed value of δ, the shallow curves the corresponding flux in the overturning zone. Intersection points are possible values of δ for stationary heat flow. Top: density ratio Rρ = 4. For the higher density ratio of 5.5 (bottom), there is no value of the thickness for which the two match (see text).
Current usage metrics show cumulative count of Article Views (full-text article views including HTML views, PDF and ePub downloads, according to the available data) and Abstracts Views on Vision4Press platform.
Data correspond to usage on the plateform after 2015. The current usage metrics is available 48-96 hours after online publication and is updated daily on week days.
Initial download of the metrics may take a while.