| Issue |
A&A
Volume 552, April 2013
|
|
|---|---|---|
| Article Number | A85 | |
| Number of page(s) | 13 | |
| Section | Planets and planetary systems | |
| DOI | https://doi.org/10.1051/0004-6361/201220494 | |
| Published online | 01 April 2013 | |
Mineralogical investigation of several Qp asteroids and their relation to the Vesta family⋆
1
Observatório Nacional,
COAA, rua Gal. José Cristino 77,
20921-400
Rio de Janeiro,
Brazil
e-mail: This email address is being protected from spambots. You need JavaScript enabled to view it.
; This email address is being protected from spambots. You need JavaScript enabled to view it.
; This email address is being protected from spambots. You need JavaScript enabled to view it.
2
Universidade Federal do Rio de Janeiro/Observatório do Valongo,
Lad. Pedro Antônio
43, 20080-090
Rio de Janeiro,
Brazil
This email address is being protected from spambots. You need JavaScript enabled to view it.
Received: 4 October 2012
Accepted: 23 January 2013
Abstract
Context. To take advantage of the large dataset provided by the SDSS data, recently a new taxonomic scheme was proposed designed to be compatible with previous taxonomies. One interesting feature in this distribution is the large number of Qp asteroids scattered all around the main belt with a marked concentration in the Vesta region, where the Vp are found most frequently. Since the mineralogy and thermal evolution traditionally related to the classical Q- and V-type taxonomic classes (and by construction the Qp and Vp), this finding was quite surprising.
Aims. We aim to observationally determine the mineralogy of a sample of Qp asteroids of and outside the Vesta family to test whether the Qp of the Vesta family are indeed basaltic, and whether the difference in band depth implied by the SDSS spectra relates to diffences in mineralogy with respect to the Vp. Moreover, we aim to determine whether the Qp outside Vesta family have an ordinary chondrite (OC) mineralogy and whether their spectra indeed correspond to Q-class asteroids.
Methods. We observed a sample of asteroids classified as Qp-type in the literature, mainly located in the Vesta family and neighborhood, to confirm their mineralogy. Spectroscopic observations of 11 asteroids were obtained at the SOAR and IRTF telescopes in the visible and near-infrared region. Thermal observations of three objects were also carried out at the Gemini South telescope in order to determine the albedo of the asteroids.
Results. The analysis indicated that all observed asteroids in the Vesta vicinity have a basalt-rich mineralogy, with no clear difference from other Vesta family members in terms of silicate composition. From our study it is not clear why these particular basaltic asteroids have a relatively suppressed band I so that they are classified as Qp. Two asteroids with an OC-compatible mineralogy were identified in the external part of the main belt, at around 2.8−2.9 AU. This discovery suggests new dynamical routes for the transport of Q-type asteroids to the near-Earth region and of OC meteorites to the Earth.
Key words: instrumentation: spectrographs / techniques: imaging spectroscopy / minor planets, asteroids: general / methods: data analysis
Based on observations performed at the Gemini, SOAR, and IRTF telescopes.
© ESO, 2013
1. Introduction
One of the main goals in the study of asteroids is to determine their surface composition and how this varies throughout the main belt, from which one can obtain important constraints on their formation and evolution. The analysis of the remote reflectance spectrum of an asteroid allows one to obtain its surface composition, or indications of it, while taxonomic classifications are intended to collectively determine distributions and trends. Establishing robust relationships between the taxonomic classes and surface mineralogy is, therefore, essential.
To do this, the most widely used technique is the direct comparison between the spectra of asteroids, of meteorites, and of minerals, the former obtained in the laboratory. Initially, most of the asteroids were separated into two major classes: those who possessed absorption features, the S class, and those who did not, the C class, the former associated to stony-iron and the latter to carbonaceous chondrite meteorites. It is noteworthy that the link between the asteroid (4) Vesta and the HED (Howardite-Eucrite-Diogenite) meteorites was determined from the direct comparison between asteroid and meteorite reflectance spectra (McCord et al. 1970).
With the progress of reflectance spectroscopy, the presence/absence of other spectral features could be detected, with new taxonomic classes being defined. Since then, several taxonomic systems were developed based on the optical properties of the bodies (Chapman et al. 1975; Bowell et al. 1978; Tholen 1984; Barucci et al. 1987; Tedesco et al. 1989; Bus & Binzel 2002; DeMeo et al. 2009). The increasingly larger available datasets along with refinements in the classification process led to a continuous increase in the number of classes, from the initial two up to the 26 defined by Bus & Binzel (2002).
In recent years, however, owing to the deeper insight on the mineralogical characterization from reflectance spectra, it has become clear that taxonomy alone is not an effective tool to infer the composition of an asteroid. Although the dominant factor in the reflectance spectra of a body is its composition, it is now clearly established that other factors that are not directly related to mineralogy can alter the spectra. Diverse studies have shown that the mineralogical characterization of asteroids can be affected by several factors such as the viewing geometry, the phase angle, and the particle size (a detailed review on this topic is given in Gaffey et al. 2002). Moreover, not all asteroids present absorption features in their spectra, which makes it very difficult to identify the minerals present on their surface.
Nevertheless, despite these difficulties, the taxonomy of asteroids is an excellent tool for studies on a large scale. The two main applications of taxonomy are the study of the compositional distribution in the main belt and the selection of objects for future detailed investigation. In this way, the number of objects that each taxonomic scheme is able to classify is an essential feature to guarantee its utility. On the other hand, a statistical study of the class distribution in the main belt requires a large and well-sampled dataset. In this sense, photometric surveys, such as the SDSS − Sloan Digital Sky Survey − http://www.sdss.org/ − as described in Ivezić et al. (2001), have a great advantage because of the larger number of observed objects, in particular, those small in size.
To take advantage of the large dataset provided by the SDSS data, Carvano et al. (2010) proposed a new taxonomic scheme designed to be compatible with previous taxonomies. In their work, nine classes are defined − Vp, Op, Qp, Sp, Ap, Lp, Dp, Xp and Cp − allowing a detailed picture of the class distribution in the main belt.
A somewhat unexpected result of Carvano et al. (2010) was the large number of Qp asteroids scattered all around the main belt that showed a marked concentration in the Vesta region, where the Vp are found most frequently. Considering that the mineralogy and thermal evolution traditionally related to the classical Q- and V-type taxonomic classes (and, by construction, the Qp and Vp) are clearly distinct this called for additional analysis.
Therefore, we decided to observationally determine the mineralogy of a sample of Qp asteroids of and outside the Vesta family to test whether the Qp of the Vesta family are indeed basaltic, and whether the differences in band depth implied by the SDSS spectra relate to a difference in mineralogy with respect to Vp asteroids. Moreover, we investigated whether the Qp outside Vesta have an ordinary chondrite (OC) mineralogy and whether their spectra indeed correspond to Q-class asteroids. That is, whether they indeed are OC-like asteroids with unweathered surfaces.
The present paper begins with a brief review of the Carvano et al. (2010) taxonomic scheme and in particular the Qp and the Vp classes and distributions. The observations and reduction of the data are presented in Sect. 3, followed by a discussion of the determination of the albedo and mineralogy. Finally, the results and a discussion of these is given in the last section.
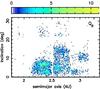 |
Fig. 1 Density map for the Qp class asteroids. Figure reproduced from Carvano et al. (2010). |
We begin by reviewing the main features of the taxonomic scheme developed by Carvano et al. (2010) which, it is important to note, was not intended to be a new taxonomy but just to provide a method to assign taxonomic classes to the asteroids listed in the SDSS Moving Object Catalog (MOC4).
First of all, the photometric magnitudes in five filters, u′g′r′i′z′, were transformed in reflectance colors without the solar contribution. Then, limits for the values of the four reflectance color gradients were computed for each class, using observations of previously classified asteroids, meteorite spectra, or synthetic spectra.
The classification algorithm was based on the computation of the probability distribution of each reflectance color gradient, and the probability of an observation to be compatible with a class was defined as the product of the probabilities at each spectral range. The best classification for the observation was chosen as the one with at least 60% of the sum of the probabilities for all possible classes. The final classification was then presented as a letter for the class plus the corresponding probability. If no class satisfied this requirement (meaning that the probabilities for the observation to be compatible with two or more classes are comparable), all classes with probabilities higher than 30% of the total probability were considered possible and a multiple letter classification was given.
The final step was the definition of the spectroscopic classes, which were chosen based on their current mineralogical interpretation and on the ability of the SDSS data to represent them. Nine classes were, thus, defined: Vp, Op, Qp, Sp, Ap, Lp, Dp, Xp, and Cp. With the exception of the Lp class, all others were intended to be directly comparable to the corresponding classes in the Bus taxonomy.
The ranges of each class were defined using the objects observed by the SMASSII (Bus & Binzel 2002) and S3OS2 surveys (Lazzaro et al. 2004). However, the ranges of the Qp class were defined using the spectra of OC meteorites available at the RELAB database since none of the objects observed by the two spectroscopic surveys was classified as belonging to class Q.
This taxonomic scheme was then applied to all observations of asteroids in the SDSS MOC4 catalog. The large number of observations available in this catalog provided a detailed picture of the distribution of the classes in the main belt, using density maps. These maps are constructed by dividing the main belt into bins of osculating semi-major axis and inclination and then counting the number of objects of a given class inside each bin.
2. The QP asteroids
The density map for the Qp class is given in Fig. 1. As can be seen in this figure, the Qp class asteroids are scattered throughout the main belt but with a remarkable concentration in the inner belt around the Vesta family. This feature is, at least, interesting because the application of the classification scheme of Carvano et al. (2010) to HED spectra showed that those with shallower bands tended to be classified as Qp. Figure 2 shows the SDSS spectra of one such asteroid compared to the templates for the Vp, Sp, and Qp classes. Therefore, an observational program was set up, aiming to derive the mineralogy of Qp asteroids to determine whether this relative band suppression is correlated to any systematic difference in mineralogy with respect to V-type objects with more characteristic band depths.
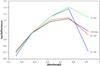 |
Fig. 2 SDSS spectra of one asteroid in the vicinity of Vesta compared to the templates for the Vp, , and Qp classes. |
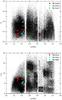 |
Fig. 3 Location of the observed asteroids in the orbital parameter space a × e (top) and a × i (bottom), where the red dots are Qp-types, the cyan dots are the Vp-type and the green dots are the -type asteroids. |
Physical parameters of the selected asteroids.
3. Observations and data reduction
A set of 11 small main belt asteroids were observed, selected among those classified as Qp-type based on their SDSS colors by Carvano et al. (2010). The selected objects are preferentially located in the vicinity of the Vesta family, although some Vp and Qp asteroids were also chosen in other regions of the main belt for comparison purposes. Their location is indicated in Fig. 3 by red, blue, and green dots, representing the Qp-, Vp-, and Sp-type, respectively. The orbital and physical parameters of the sample are given in Table 1. For each asteroid is given the semi-major axis a, eccentricity e, inclination i, absolute magnitude H, photometric class from Carvano et al. (2010), confidence level, and its belonging to a dynamical family. The orbital parameters are taken from JPL Small-Body Database Browser1, while the membership to a dynamical family is taken from Nesvorný (2010).
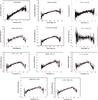 |
Fig. 4 Visible reflectance spectra for the observed asteroids; superimposed in red the SLOAN photometric color. |
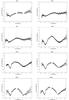 |
Fig. 5 Near-infrared spectra for observed asteroids. All spectra are normalized at 1.6 μm. |
The asteroids were observed in the visible region, as well as, or, in the near-infrared and thermal infrared. The visible spectra were acquired with the Goodman Spectrograph at the Southern Astrophysical Research (SOAR) Telescope, a 4.1 m aperture telescope on Cerro Pachón, Chile. The set-up was defined by a 1.03′ slit, a blocking filter GG-385, a grating with 300 l/mm and a CuHeAr lamp. This configuration gives a spectrum ranging from 0.32 to 0.85 μm. Observations were made in remote mode during three consecutive nights, from 5 to 7 August of 2010.
The data obtained with SOAR telescope were reduced with the IRAF package. Science targets were reduced by subtracting the combined bias and applying flat-field correction. The wavelength calibration was established by identifying the emission lines of the CuHeAr lamp. The same procedures were performed for the observed solar analog stars: SA113276, SA115271, HR6060, and 18Scorpii. The asteroid spectra was then rationed by the solar analog spectra with an air mass closer to that of the target asteroid. The resulting reflectance spectra were normalized to unity at 0.6231 μm (the wavelength that corresponds to the SLOAN r′ filter). With the exception of one, asteroid 16651, all spectra have good signal-to-noise ratio, as can be seen in Fig. 4 where for comparison purposes we included (in red) the SLOAN photometric points.
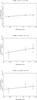 |
Fig. 6 NEATM fits to the thermal observations for the asteroids (7302)1993 CQ, (11699) 1998 FL105, and (11876) Doncarpenter. |
The near-infrared spectra were adquired remotely from the National Observatory with the 3.0-m NASA Infrared Telescope Facility (IRTF) equipped with a 1024 × 1024 InSb array spectrograph (SpeX) that is located at the Mauna Kea Observatory in Hawaii, on the nights of August 13 and 14, 2010. We used a 0.8 arcsec slit oriented in the east-west direction. In the low-resolution prism-mode, this slit provides a resolution R ∼ 100, with a spectrum covering the entire interval from 0.8−2.5 μm in a single exposure. To reduce the data, we followed the standard procedures of flat-field correction and sky subtraction. The spectra were then extracted and calibrated in wavelength. Several spectra of the two solar analogs HD139464 and HD139287 were taken during the night and were used to produce normalized reflectance spectra of the asteroids. The final spectra presented in Fig. 5 are the ratio of the asteroid spectra with the solar analog with a closer airmass to that of the asteroids.
Observational circumstances for the observed asteroids.
The observational circumstances for the 11 asteroids observed with SOAR and the 8 asteroids observed with IRTF are given in Table 2. The table gives the UT date of observation, the exposure time, the mean air mass, the phase angle, the visual magnitude, and the solar analog used in the reduction. We note that the IRTF observations were performed with the asteroids at air mass ranging from 1.06 to 1.65, mostly above 1.2, while the SOAR ones were performed preferentially at air masses around 1.1. The asteroids were observed at phase angles ranging from 2.4 up to 24.9, mostly around 10 degrees. For the objects observed with the two telescopes the phase angles are very compatible since the observations were performed within a week.
Thermal infrared observations.
The thermal infrared data were obtained from the Gemini South telescope at Cerro Pachón, Chile for three asteroids in the sample. We used T-ReCs to obtain thermal photometry of the targets on the Si4−10.4 μm, Si5−11.7 μm, and Si6−12.3 μm filters. The observations were made in service mode, between September 26 and October 30, 2011. Data reduction was made using the IRAF tasks mireduce and phot. Thermal infrared flux standard stars from Cohen et al. (1999) were observed close in time to the asteroid observations to allow flux calibration. For the filters used, the color correction factors are on the order of 1%, and can be disregarded. The time intervals between the acquisition of the first and last filter for asteroids (7302), (11699), and (11876) were 10, 15 and 30 min, approximately. The final results for the sample are shown in Table 3.
NEATM fits to the thermal observations.
4. Data analysis
4.1. Albedo
The albedo and beaming parameter of the asteroids observed in the thermal infrared were calculated using the near-Earth thermal model − NEATM (Delbó & Harris 2002). To do this and to facilitate a comparison of our results with the WISE dataset, we followed Masiero et al. (2011) and limited the fitting range for η to between 0.03 and π, which is the theoretic maximum for a spherical asteroid. The uncertainties of the fitted values were estimated by repeating the procedure 100 times, randomly varying the photometry in each filter within the nominal uncertainties. The best fits for the nominal values are shown in Fig. 6. For all fits we adopted an emissivity of ϵ = 0.9. Since none of the asteroids have a known slope parameter, we adopted the default value of G = 0.15. The derived parameters, the adopted H magnitude, and the observation geometry for each asteroid are listed in Table 4, along with the WISE albedo, when available. In this table, the heliocentric (R) and geocentric (Δ) distances are given in astronomical units, the phase angle (g) in degrees, and the derived diameter in kilometers. For pv and η the values correspond to the best fit to the nominal data; the quoted uncertainties are the values that encompass 90% of the synthetic sample. Despite the low sigal-to-noise ratio of the observations of (11699) 1998 FL105 and (11876) Doncarpenter (and thus of the large nominal uncertainties of the derived parameters), the good agreement between our values and those from WISE for (11699) and (7302) suggest that the nominal albedo for (11876) Doncarpenter is a sufficently good estimate. The actual uncertainties should in principle account for the finite time interval between each filter aquisition and the effects of asteroid rotation. However, none of the asteroids observed in the MIR have period determinations.
4.2. Mineralogy
The mineralogical characterization of remotely observed asteroids and the investigation of possible genetic links with meteorites involve the analysis of spectral parameters. Most minerals exhibit characteristic absorption bands in the visible and near-infrared (VNIR) regions, where most asteroids are observed. Therefore, identifying these bands in the asteroid spectra is indicative of the presence of a particular mineral. The set of the most relevant absorption bands are related to mafic materials, such as olivine and pyroxene. Analyzing the bands present in a spectrum (Cloutis et al. 1986) is useful to characterize the data and can be used to obtain the mineralogical information. The parameters that are used are the band minimum, centre, and depth, as well as the ratio of the bands area.
According to Cloutis et al. (1986), the band-I area is defined as the area enclosed by the spectral curve and a straight line tangent to the maxima at 0.7 and 1.4 μm. On the other hand, the band-II area is enclosed by the spectral curve and a straight line fixed at 2.4 (since in general the absorption wing is not complete) and tangent to maximum at 1.4 μm. The parameter BAR (band-area ratio) is defined as the ratio between the band-II area and band-I area. The depth of the bands can be determined by drawing a line between the two maxima of the spectrum, called the slope of the band.
In the case of mafic elements, olivine exhibits a broad asymmetric band near 1 μm, orthopyroxene (low-calcium pyroxene) exhibits two well-defined absorption bands near 1 and 2 μm (band-I and band-II, respectively), and clinopyroxene (calcic pyroxenes) exhibits two complex absorption bands near 1 and 2 μm. The depth of these absorption bands depends directly on the abundance of the olivine and pyroxene present in the body. For both mineral species the depth increases with increasing iron content (Adams 1975; Burns 1970; Hunt & Salisbury 1970; Hazen et al. 1977, 1978). The center position of the bands (band-I center and band-II center) exhibit a strong correlation with the associated mineralogy. An example from among the pyroxenes is that the orthopyroxene bands shift to longer wavelengths with increasing iron contents, while clinopyroxenes shift to longer wavelengths with increasing calcium contents (Gaffey & McCord 1976; Adams 1974; Cloutis & Gaffey 1991). The BAR paramenter indicates the relative abundance of each mineral.
To determine the mineralogy of asteroids that have a full VNIR spectrum we used a program developed by Vishnu Reddy. Spectral band parameters including the band I and II centers and the BAR were extracted after dividing the absorption bands with a straight-line continuum. A detailed description of the data reduction procedure can be found in Reddy (2009). It is important to note that even when we had a full VNIR spectrum, only the infrared region was used. Since the near-infrared spectrum obtained at IRTF range from 0.64 to 2.55 μm it comprises the two maxima of the spectrum, which allows the determination of all relevant parameters. This removes the error associated to the combination of visible and NIR spectra, which are usually taken at different times and with different instruments.
The spectrum was thus divided into two parts: one ranging between 0.6 and 1.5 μm, the other between 1.4 and 2.5 μm. Using the hightest reflectance values near 0.7 and 1.4 μm, we computed a linear continuum to that region. Similarly, a continuum was computed for the region between 1.4 and 2.5 μm. The two continua were then removed to their corresponding spectral regions. The obtained continuum-subtracted spectrum was then used to determine the band minimum, near 0.9 and 1.4 μm, fitting a second-order polynomial in each region. Band centers, area, and depth were also determined, as well as the BAR.
Table 5 provides the mineralogical parameters obtained for the eight asteroids with NIR spectra. The inferred mineralogy for each asteroid is given, along with the values for the band-I and band-II centers and the BAR. The band-I centers range from 0.921 to 0.968, the band-II centers from 1.892 to 1.956 and the BAR from 0.566 to 2.67.
To better visualize these results they were plotted in a classical plot of BAR versus band-I center, developed by Gaffey et al. (1993) who used meteorites to define the diverse mineralogical regions and related asteroid classes. In the plot (Fig. 7) the regions corresponding to olivine [S(I)], olivine and pyroxene mixtures [S(II)−S(VI)], and basaltic [S(VII) and basalt] are marked.
Of the asteroids, five present a mineralogy compatible with basalt, while the remaining three asteroids show mixtures of olivine and pyroxene. In addition, two of these asteroids, both located in the intermediate belt, are classified as belonging to the S(IV) subtype, which is compatible with ordinary chondrites.
5. Discussion
5.1. SDSS colors x VNIR spectra
We observed 11 objects in the visible and/or near-infrared regions that are classified as Qp-type according to their SDSS colors. Most of these asteroids are located in the vicinity of the Vesta family, in the inner main belt, and only three are located in the intermediate and outer belt.
The mineralogical analysis of the selected asteroids indicates that although the SLOAN colors suggest that they belong to the Qp class, their mineralogy is consistent with HED meteorites. As can be seen in Table 5, all objects located near the Vesta family have a basaltic composition compatible with the HED meteorites, which are usually associated with the taxonomic V-class.
To compare the SLOAN photometric points with the obtained VNIR spectra we overplotted them in Fig. 8. In the figure the black line is the full VNIR spectrum while the red line links the photometric SLOAN colors. Each spectrum was normalized at 0.6231 μm, the wavelength corresponding to the SLOAN r′ filter.
One difference between the SLOAN and VNIR spectra is that for the three non-basaltic objects − (3303), (4184) and (7302) − the last SLOAN point, corresponding to the z′ flux, reaches the minimum of the 1-μm band. This is not the case for the basaltic asteroid spectra.
According to the median log reflectance spectra for the classes, as given in Carvano et al. (2010), the distinction between Qp and Vp is the steepness of the i′ and z′ fluxes difference. It is noteworthy that Roig & Gil-Hutton (2006) already used this as a criterion to identify putative V-type asteroids. In any case, for the observed asteroids, the steepness between the i′ and z′ fluxes obviouly is greater for the basaltic asteroids than for the three non-basaltic asteroids.
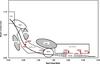 |
Fig. 7 Band I center vs. BAR plot showing the olivine-pyroxene mixing line and the S-asteroid subtypes from Gaffey et al. (1993). Spectral band parameters of the observed asteroids are plotted to show their affinity to a specific subtype. The ordinary chondrite meteorites are plotted in the S(IV) region and the basaltic achondrites, or HED meteorites, in the BA region. |
Mineralogical parameters obtained for the eight asteroids with NIR spectra.
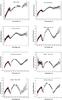 |
Fig. 8 VNIR spectra (black dots) compared with SLOAN photometric points (red line). |
Phase angle for each observed asteroid and the associated mineralogy/taxonomy.
Therefore, at least in the Vesta family, Qp asteroid seem to correspond to objects with basaltic mineralogies, such as HED meteorites (BA region in Fig. 7), with a shallower band-I. This relative band-I suppression does not seem to be related to differences in silicate composition with respect to Vp in the sample or to the bulk of the Vesta family.
It is interesting to note, however, that the spectrum of the only Vp with NIR data (11699) has an asymetrical maximum between the bands, while for all four Qp this tends to be more rounded and symetrical. The difference in the shape of the maxima may be caused by a difference in grain sizes: larger grain sizes in lab spectra of HEDs produce more symmetrical maxima and also decrease the band-I depth (Burbine et al. 2001). Our present sample is too small, however, to warrant any firm conclusions. In the PDS archive data (Bus 2011) we found 21 other asteroid classified as Qp (2 objects) or Vp (19 objects) with NIR spectra. Of these, 15 have asymetrical maxima and 6 have more rounded maxima. However, both Qp here show asymetrical maxima. Considering all data together, it seems that rounded maxima are more common among (but not exclusive in) Qp objects. However, the sample is still too small, and this result could be due simply to small-number statistics. Therefore, relating the lower band-I depth of the Qp to differences in grain size is tentative at best and needs to be verified quantitatively with a larger sample.
Our observational result clearly demonstrate that the Qp asteroids in the (4) Vesta family are characterized by a basalt-rich mineralogy. On the other hand, the Vp asteroid located in the outer border of the intermediate belt, (7302) 1993 CQ, presents a mineralogy compatible with ordinary chondrites. Moreover, the Qp asteroid in the outer belt does, indeed, present an OC composition, in accordance with what is normally expected from that taxonomic classification; however, its observed VNIR spectrum is actually more similar to S-class asteroids.
5.2. Albedo, H magnitude, and phase angle
Thermal observations of three objects were performed. Two of the objects were classified as Vp, (7302) 1993 CQ and (11699) 1998 FL105, and one as Qp, (11876) Doncarpenter. The mineralogical analysis, however, indicated that the first is an S(IV) while the second is a basalt asteroid. The derived albedos for the three objects are quite similar, with a varying error of about 20%. It is noteworthy that the lower albedo is obtained for the OC-like asteroid, which is of  , the smaller error. This value is also compatible with the one obtained from WISE (Masiero et al. 2011).
Considering the overall distribution of WISE albedos in the observed sample (Table 1), the distribution seems bimodal, with four objects with albedos greater than 0.4 and another four with albedos around 0.25. In particular, the only Vp-class asteroid, (11699) 1998 FL105, has the lowest albedo.
At this point it is instructive to use larger samples to compare the physical properties of the Qp and Vp in the Vesta family in more detail and also to check whether there is any systematic difference between the Qp in the the family and the objects with this classification that are not family members; for the latter we consider here only objects with a < 2.5 AU to minimize effects of any heliocentric gradient. We considered the distributions in absolute magnitude and solar phase angle for the objects with SDSS classification, and then the distributions of absolute magnitude, geometric albedo, and diameter for objects for which we also have WISE data (Masiero et al. 2011). Determining the absolute magnitude H depends on the slope parameter G, which for most asteroids is unknown and was set to the default value of 0.15. In turn, determining the albedo from WISE measurements depends on the assumed value of H. Therefore, the distribution of this parameter might be affected by the subjacent distribution of G.
To assess whether or not any two distributions can be considered different, we used a Kolmogorov-Smirnov (KS) test at a significance level of 1%, that is, two distribution are considered to be statistically different if pKS < 0.01.
Considering the distributions in absolute magnitude (H) and phase angle (g), we have samples with 1147 Vp and 297 Qp for the objects in the family according to the family definition of Nesvorny et al. (2012), and 1366 Qp outside it with a < 2.5 AU (Fig. 9). For the family members, the distribution in H of the Qp is statistically different from the distribution of the Vp (pKS = 0.008), with a slight shift of the peak of the Qp toward higher values of H. We also found that the distribution in g of the two samples is very different (pKS ≃ 0.0), with a marked peak of the Qp at smaller phase angles. Comparing now the distributions of the inner belt (a < 2.5 AU) Qp within and outside of the Vesta dynamical family, we find a marked difference in the distribution in H (pKS ≃ 0.0), with the non-family-members visibly shifted toward higher magnitudes. However, the distributions in phase angle cannot be distinguished (pKS = 0.039).
We consider now the distributions of those groups for the objects with WISE data. We have 314 Vp and 50 Qp in the family and 138 Qp outside it and with a < 2.5 AU (Fig. 10). With this sample, it is no longer possible to distinguish the distribution in H of the Qp and Vp in the Vesta family, nor can their distributions in geometric albedo and diameter be distinguished. On the other hand, the inner belt QP within and outside of the family have different distributions in H, (pKS = 3 × 10⁻⁵), in geometric albedo (pKS = 1.4 × 10⁻⁴), and in diameter (pKS = 1.8 × 10⁻³); the non-family-member Qp tend to be fainter, smaller, and darker than the family members with the same classification. In particular, the Qp in the family have median WISE visible geometric albedo of 0.367, compared with a median albedo of 0.293 for Qp that are not dynamically related to the Vesta family. Note that a similar result was reached by Mainzer et al. (2012).
Differences in the distribution of absolute magnitudes of asteroid populations subject to similar observational bias tend to indicate differences in the physical properties of those populations. This is clearly the case of the Qp within and outside of the Vesta family. For the Qp and Vp in the family, on the other hand, the differences hinted at by the distribution in H are not confirmed in the sample with WISE data. Since the latter sample is deficient in objects with H > 16, differences in the physical properties among these two groups, if real, must be restricted to the fainter asteroids. On the other hand, we stress that the difference between Qp and Vp classes is mostly caused by the flux on the z band, and observations classified as Vp have substantially lower fluxes on this band than those assigned to the Qp class. This means that at the detection limit putative Vp observations could have z fluxes below the detection limit (and therefore be rejected), while Qp could still be registered. This effect could induce an bias toward detecting preferentially Qp at lower magnitudes, and could explain the observed difference in the distributions in H. The observed overabundance at smaller phase angles of Qp asteroids both within and outside of the Vesta family, however, suggests that there is also a component here that only depends on the observational geometry, which tends to make it more likely that an asteroid observed closer to opposition is classified as a Qp.
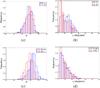 |
Fig. 9 a) magnitude distribution for Vp and Qp family members; b) solar phase angle distribution for Vp and Qp family members; c) magnitude distribution for Qp with a < 2.5 AU, within and outside the family; d) solar fase angle distribution for the sample in c). The family definition is taken from Nesvorny et al. (2012). The phase angle corresponds to the SDSS observation considered most representative according to Carvano et al. (2010). |
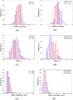 |
Fig. 10 a) magnitude distribution of the sample of Vp, Qp in the family; b) same as previous for the Qp with a < 2.5 AU, within and outside the family; c) distribution of WISE albedos for sample a); d) distribution of WISE albedos for sample b); e) distribution of WISE diameters for sample a); f) distribution of WISE diameters for sample b). |
At this point we can say with a high degree of confidence that the Qp in the Vesta family are mostly basaltic, and different in composition from the Qp found elsewhere in the main belt. We are still unable to further constrain the mineralogical associations to the Qp outside Vesta. Considering, however, that by construction, asteroids with unweathered OC-like spectra should end up in this class, and that asteroids in the main belt with OC-like mineralogy tend to have S-type spectra (Gaffey et al. 1993), it is interesting to use the same methodology as above to compare the distributions of Sp and Qp outside the Vesta family. We again divided the samples according to semi-major axis. Using objects with SDSS classification only, we have 6373 Sp and 1366 Qp in the inner belt (a < 2.5 AU), and 9163 Sp and 1553 Qp with a > 2.5 AU. For both regions, the distribution in H of the Sp is clearly different from the Qp (pKS ≃ 0.0), with the distributions of Qp shifted to fainter magnitudes; the distributions in g for both regions are also different (pKS ≃ 0.0), with again the Qp showing a marked concentration toward smaller phase angles (Fig. 11). Considering now asteroids with also WISE data, we have 1791 Sp and 138 Qp in the inner belt and 2742 Sp and 174 Qp in the outer belt (Fig. 12). For the inner belt we find that the distributions on H and diameter are statistically different (pKS = 3.5 × 10⁻⁶ and pKS = 3.0 × 10⁻⁹) with the Qp being fainter and smaller, but that the albedo distributions cannot be distinguished (pKS = 0.26). For the outer belt, the distribution of H and albedo are statistically different (pKS = 6.5 × 10⁻⁸ and pKS = 8.0 × 10⁻⁸), but here the diameter distributions cannot be distinguished (pKS = 0.019).
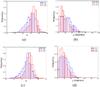 |
Fig. 11 Same as Fig. 9, comparing the distributions of Qp and with a < 2.5 AU (a) and b)), and the distributions of Qp and with a > 2.5 AU (c) and d)). |
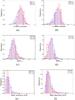 |
Fig. 12 Same as Fig. 10 comparing the distributions of Qp and with a < 2.5 AU (a), c) and e)) and the distributions of Qp and with a > 2.5 AU (b), d) and f)). |
Therefore, the physical properties of non-Vesta-family Qp asteroids seem different from the Sp class; however, a more conclusive interpretation of this is marred by the lack of a clear mineralogical characterization for both classes. And again, the predominance of Qp classification for objects observed at low phase angles compared with the distribution in phase of Sp asteroids suggests that there is an important geometric component involved that tends to lead to a classification of objects with pyroxene/olivine bands (wheter basaltic in composition or not) as Qp when observed close to opposition, or that there is an observational bias.
6. Conclusions
We mineralogically characterized several Qp class asteroids located in the vicinity of (4) Vesta, and tried to determine their relation to the Vesta family. This was achieved through observing diverse asteroids in the infrared and/or visible regions with the SOAR and IRTF telescopes. For the asteroids observed in the visible and near-infrared regions, the obtained spectra were combined, resulting in a full VNIR spectrum ranging from 0.32 to 2.5 μm. The mineralogical characterization was then performed using the spectral parameter analysis.
The main results can be summarized as follows.
-
1.
The mineralogical analysis showed that all observed asteroidsin the Vesta vicinity have a basalt-rich mineralogy, with no cleardifference from other Vesta family members in terms of silicatemineralogy.
-
2.
It is not clear so far why these particular basaltic asteroids have a relatively suppressed band-I and are consequently classified as Qp. We can rule out a darker, neutral mineral phase, however, since there is no significant albedo difference with respect to Vp asteroids. There is some indication that differences in grain sizes might be involved, but this is not statistically robust.
-
3.
The difference in the albedo distribution of the Qp asteroids outside the Vesta family with respect to both Vp and Qp family members suggests, in general, different compositions than those of the family members. However, the higher albedo Qp outside the family may still be regarded as potentially basaltic.
-
4.
Wherever they are in the main belt, asteroids with olivine/pyroxene compositon seem to have a higher probability to be classified as Qp if they are observed at low phase angles.
-
5.
Two asteroids with an OC-compatible mineralogy were identified in the external part of the main belt, around 2.8−2.9 AU.
Moreover, the two confirmed asteroids with OC-like mineralogy are located one at the outer border of the intermediate belt, very close to the 5:2 mean motion resonance with Jupiter, and the other in the outer belt. This can suggest new dynamical routes for the transport of Q-type asteroids to the near-Earth region and of OC meteorites to the Earth. This discovery is also relevant to the long-lasting discussion on the lack of OC parent bodies in the main belt. In particular, it is very difficult to consider that these Q-type asteroids are indeed of the S-type but with a refreshed surface originating from close encounters with the inner planets (Nesvorný et al. 2005; Binzel et al. 2010).
Interestingly, (3303) Merta is a member of the Koronis dynamical family, where Rivkin et al. (2011) recently found some small (3.5 km and smaller) objects presenting visible OC-like colors. According to the authors, this would be consistent with a chondritic composition for the Koronis family, as has been suggested in other works, and it also suggests that space-weathering processes act on similar order-of-magnitude timescales as the typical refresh time on the 25-km main-belt asteroids. On the other hand, the present mineralogical analysis of (3303) Merta, which has an estimated size of about 10 km, nearly the double of the limiting size given by Rivkin et al. (2011), still indicates an unweathered and/or young surface. This might indicate that the linkage between Q-type asteroids and S-type alleged space-weathering processes might need some revision. Moreover, our finding demonstrates that OC-compatible material does exist throughout the main belt of asteroids.
To conclude, we highlight the need to continue the mineralogical investigation of the asteroids classified as type Qp by Carvano et al. (2010) because only a statistically significant dataset can reveal the true nature of this very intriguing class.
Acknowledgments
F.L.J. would like to thank the CAPES, Brazil, which supported this work via a Ph.D. fellowship. J.M.C., D.L. and T.M.-D. would like to thank the Conselho Nacional de Desenvolvimento Científico e Tecnológico (CNPq) and the Fundação de Amparo a Pesquisa do Estado do Rio de Janeiro (FAPERJ), which supported this work through diverse fellowships and grants. Based on observations obtained at the Gemini, SOAR and IRTF. The Gemini Observatory is operated by the Association of Universities for Research in Astronomy, Inc., under a cooperative agreement with the NSF on behalf of the Gemini partnership: the National Science Foundation (United States), the Particle Physics and Astronomy Research Council (UK), the National Research Council (Canada), CONICYT (Chile), the Australian Research Council (Australia), CNPq (Brazil) and CONICET (Argentina). The SOAR telescope is a joint project of: Conselho Nacional de Pesquisas Científicas e Tecnológicas CNPq-Brazil, the Univeristy of North Carolina at Chapel Hill, Michigan State University, and the National Optical Astronomy Observatory. The Infrared Telescope Facility, is operated by the University of Hawaii under Cooperative Agreement No. NCC 5-538 with the National Aeronautics and Space Administration, Science Mission Directorate, Planetary Astronomy Program. We are grateful to the entire staff of the Gemini, SOAR and IRTF telescopes, who assisted us in the observational programs.
References
- Adams, J. B. 1974, J. Geophys. Res., 79, 4829 [NASA ADS] [CrossRef] [Google Scholar]
- Adams, J. B. 1975, in Infrared and Raman Spectroscopy of Lunar and Terrestrial Minerals (New York: Academic Press), 91 [Google Scholar]
- Barucci, M. A.,Capria, M. T.,Coradini, A., &Fulchignoni, M. 1987, Icarus, 72, 304 [NASA ADS] [CrossRef] [Google Scholar]
- Binzel, R. P.,Morbidelli, A.,Merouane, S., et al. 2010, Nature, 463, 331 [Google Scholar]
- Bowell, E.,Chapman, C. R.,Gradie, J. C.,Morrison, D., &Zellner, B. 1978, Icarus, 35, 313 [NASA ADS] [CrossRef] [Google Scholar]
- Burbine, T. H.,Buchanan, P. C.,Binzel, R. P., et al. 2001, Meteor. Planet. Sci., 36, 761 [Google Scholar]
- Burns, R. G. 1970, in Mineralogical Applications of Crystal field Theory (Cambridge Univ. Press), 224 [Google Scholar]
- Bus, S. J. 2011, NASA Planetary Data System, 158 [Google Scholar]
- Bus, S. J., &Binzel, R. P. 2002, Icarus, 158, 146 [NASA ADS] [CrossRef] [Google Scholar]
- Carvano, J. M.,Hasselmann, P. H.,Lazzaro, D., &Mothé-Diniz, T. 2010, A&A, 510, A43 [NASA ADS] [CrossRef] [EDP Sciences] [Google Scholar]
- Chapman, C. R.,Morrison, D., &Zellner, B. 1975, Icarus, 25, 104 [NASA ADS] [CrossRef] [Google Scholar]
- Cloutis, E. A., &Gaffey, M. J. 1991, J. Geophys. Res., 96, 22809 [NASA ADS] [CrossRef] [Google Scholar]
- Cloutis, E. A.,Gaffey, M. J.,Jackowski, T. L., &Reed, K. L. 1986, J. Geophys. Res., 91, 11641 [Google Scholar]
- Cohen, M.,Walker, R. G.,Carter, B., et al. 1999, AJ, 117, 1864 [NASA ADS] [CrossRef] [Google Scholar]
- Delbó, M., &Harris, A. W. 2002, Meteor. Planet. Sci., 37, 1929 [Google Scholar]
- DeMeo, F. E.,Binzel, R. P.,Slivan, S. M., &Bus, S. J. 2009, Icarus, 202, 160 [NASA ADS] [CrossRef] [Google Scholar]
- Gaffey, M. J., &McCord, T. B. 1976, NASA STI/Recon Technical Report N, 77, 33006 [NASA ADS] [Google Scholar]
- Gaffey, M. J.,Burbine, T. H.,Piatek, J. L., et al. 1993, Icarus, 106, 573 [NASA ADS] [CrossRef] [Google Scholar]
- Gaffey, M. J., Cloutis, E. A., Kelley, M. S., & Reed, K. L. 2002, in Asteroids III, 183 [Google Scholar]
- Hazen, R. M., Mao, H. K., & Bell, P. M. 1977, in 8th Lunar and Planetary Science Conf. Proc., ed. R. B. Merril, 1081 [Google Scholar]
- Hazen, R. M., Bell, P. M., & Mao, H. K. 1978, in 9th Lunar and Planetary Institute Science Conf., 483 [Google Scholar]
- Hunt, G. R., &Salisbury, J. W. 1970, Mod. Geol., 1, 283 [Google Scholar]
- Ivezić, Ž.,Tabachnik, S.,Rafikov, R., et al. 2001, AJ, 122, 2749 [NASA ADS] [CrossRef] [Google Scholar]
- Lazzaro, D.,Angeli, C. A.,Carvano, J. M., et al. 2004, Icarus, 172, 179 [CrossRef] [Google Scholar]
- Mainzer, A.,Grav, T.,Masiero, J., et al. 2012, ApJ, 760, L12 [NASA ADS] [CrossRef] [Google Scholar]
- Masiero, J. R.,Mainzer, A. K.,Grav, T., et al. 2011, ApJ, 741, 68 [NASA ADS] [CrossRef] [Google Scholar]
- McCord, T. B.,Adams, J. B., &Johnson, T. V. 1970, Science, 168, 1445 [NASA ADS] [CrossRef] [PubMed] [Google Scholar]
- Nesvorný, D. 2010, NASA PDS, 133 [Google Scholar]
- Nesvorný, D.,Jedicke, R.,Whiteley, R. J., &Ivezić, Ž. 2005, Icarus, 173, 132 [NASA ADS] [CrossRef] [Google Scholar]
- Reddy, V. 2009, Ph.D. Thesis, University of North Dakota, Grand Forks [Google Scholar]
- Rivkin, A. S.,Thomas, C. A.,Trilling, D. E.,Enga, M.-T., &Grier, J. A. 2011, Icarus, 211, 1294 [NASA ADS] [CrossRef] [Google Scholar]
- Roig, F., &Gil-Hutton, R. 2006, Icarus, 183, 411 [NASA ADS] [CrossRef] [Google Scholar]
- Tedesco, E. F.,Williams, J. G.,Matson, D. L., et al. 1989, AJ, 97, 580 [NASA ADS] [CrossRef] [Google Scholar]
- Tholen, D. J. 1984, Ph.D. Thesis, Arizona Univ., Tucson [Google Scholar]
All Tables
All Figures
|
Fig. 1 Density map for the Qp class asteroids. Figure reproduced from Carvano et al. (2010). |
| In the text | |
|
Fig. 2 SDSS spectra of one asteroid in the vicinity of Vesta compared to the templates for the Vp, , and Qp classes. |
| In the text | |
|
Fig. 3 Location of the observed asteroids in the orbital parameter space a × e (top) and a × i (bottom), where the red dots are Qp-types, the cyan dots are the Vp-type and the green dots are the -type asteroids. |
| In the text | |
|
Fig. 4 Visible reflectance spectra for the observed asteroids; superimposed in red the SLOAN photometric color. |
| In the text | |
|
Fig. 5 Near-infrared spectra for observed asteroids. All spectra are normalized at 1.6 μm. |
| In the text | |
|
Fig. 6 NEATM fits to the thermal observations for the asteroids (7302)1993 CQ, (11699) 1998 FL105, and (11876) Doncarpenter. |
| In the text | |
|
Fig. 7 Band I center vs. BAR plot showing the olivine-pyroxene mixing line and the S-asteroid subtypes from Gaffey et al. (1993). Spectral band parameters of the observed asteroids are plotted to show their affinity to a specific subtype. The ordinary chondrite meteorites are plotted in the S(IV) region and the basaltic achondrites, or HED meteorites, in the BA region. |
| In the text | |
|
Fig. 8 VNIR spectra (black dots) compared with SLOAN photometric points (red line). |
| In the text | |
|
Fig. 9 a) magnitude distribution for Vp and Qp family members; b) solar phase angle distribution for Vp and Qp family members; c) magnitude distribution for Qp with a < 2.5 AU, within and outside the family; d) solar fase angle distribution for the sample in c). The family definition is taken from Nesvorny et al. (2012). The phase angle corresponds to the SDSS observation considered most representative according to Carvano et al. (2010). |
| In the text | |
|
Fig. 10 a) magnitude distribution of the sample of Vp, Qp in the family; b) same as previous for the Qp with a < 2.5 AU, within and outside the family; c) distribution of WISE albedos for sample a); d) distribution of WISE albedos for sample b); e) distribution of WISE diameters for sample a); f) distribution of WISE diameters for sample b). |
| In the text | |
|
Fig. 11 Same as Fig. 9, comparing the distributions of Qp and with a < 2.5 AU (a) and b)), and the distributions of Qp and with a > 2.5 AU (c) and d)). |
| In the text | |
|
Fig. 12 Same as Fig. 10 comparing the distributions of Qp and with a < 2.5 AU (a), c) and e)) and the distributions of Qp and with a > 2.5 AU (b), d) and f)). |
| In the text | |
Current usage metrics show cumulative count of Article Views (full-text article views including HTML views, PDF and ePub downloads, according to the available data) and Abstracts Views on Vision4Press platform.
Data correspond to usage on the plateform after 2015. The current usage metrics is available 48-96 hours after online publication and is updated daily on week days.
Initial download of the metrics may take a while.