Fig. 4
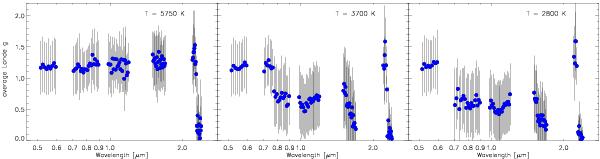
Average Landé g factors for lines deeper than 2% of the continuum in the modeled spectra range (blue circles) together with rms scatter of all Landé g values considered in that region (error bars). The three panels show three different atmospheric temperatures as indicated in the figure. The low values at 2.3 μm are caused by the CO band.
Current usage metrics show cumulative count of Article Views (full-text article views including HTML views, PDF and ePub downloads, according to the available data) and Abstracts Views on Vision4Press platform.
Data correspond to usage on the plateform after 2015. The current usage metrics is available 48-96 hours after online publication and is updated daily on week days.
Initial download of the metrics may take a while.