Fig. 7
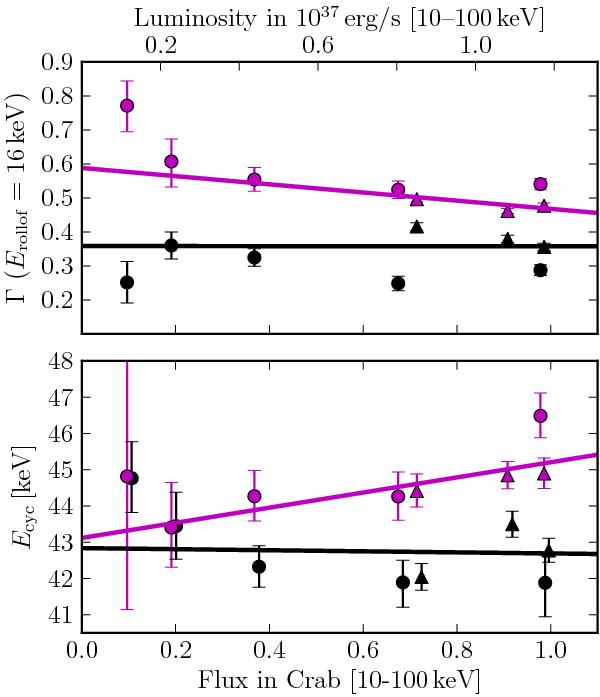
Best-fit spectral parameters as a function of flux for the main peak (phase interval 0.1–0.5) and the secondary peak (phase interval 0.6–1.0) of the pulse profile. The data points and the linear fit (solid line) corresponding to the main peak are shown in black. The data corresponding to the secondary peak are shown in magenta. As in previous figures, the INTEGRAL observations are marked with circles, the RXTE observations – with triangles. For the upper plot, Erolloff was fixed to 16.0 keV (see text). For the bottom plot all fit parameters are kept free. The corresponding values for the linear fit and the significance are shown in Table 3.
Current usage metrics show cumulative count of Article Views (full-text article views including HTML views, PDF and ePub downloads, according to the available data) and Abstracts Views on Vision4Press platform.
Data correspond to usage on the plateform after 2015. The current usage metrics is available 48-96 hours after online publication and is updated daily on week days.
Initial download of the metrics may take a while.