Fig. 10
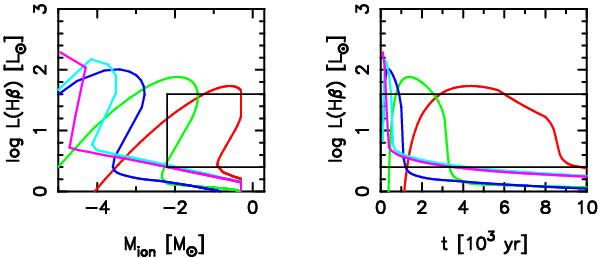
Evolution of the PN toy model described in Sect. 7 for PNe having progenitor masses (from right to left) of 2 M⊙ (red), 2.5 M⊙ (green), 3 M⊙ (blue), 4 M⊙ (cyan), 5 M⊙ (magenta). For 1 M⊙, the Hβ luminosity would be too small to be detected. The black box in the left panel indicates the observed range for our PNe. The right panel indicates the time evolution of L(Hβ) since the formation of the PN model. It illustrates that the chance to observe a PN having a progenitor mass of 2 M⊙ is much larger than for 2.5 M⊙.
Current usage metrics show cumulative count of Article Views (full-text article views including HTML views, PDF and ePub downloads, according to the available data) and Abstracts Views on Vision4Press platform.
Data correspond to usage on the plateform after 2015. The current usage metrics is available 48-96 hours after online publication and is updated daily on week days.
Initial download of the metrics may take a while.